Article Text

Abstract
Although rapid response capacity has been instituted in many cities following recent catastrophic heatwave events, the recognition that theoretically preventable heat-related deaths may occur throughout the summer has provoked much less response. This essay reviews published estimates of the general summertime temperature–mortality relationship characterised in different settings around the world. A random-effects meta-regression is applied to the estimates in relation to a number of standardised city-level characteristics of demography, economy and climate. Heat thresholds were generally higher in communities closer to the equator, suggesting some population adaptation. In almost half of the locations, the risk of mortality increased by between 1% and 3% per 1°C change in high temperature. Increasing population density, decreasing city gross domestic product and increasing percentage of people aged 65 or more were all independently associated with an increase in the heat slope. Improved care of older people, residential architecture and urban planning measures to reduce high temperatures in densely populated areas are likely to play a key role alongside targeted heat-health warning systems in reducing future heat burdens.
- Heat
- weather
- mortality
- climate change
- urbanisation
- climate
- environmental epidem
- environmental health
This is an open-access article distributed under the terms of the Creative Commons Attribution Non-commercial License, which permits use, distribution, and reproduction in any medium, provided the original work is properly cited, the use is non commercial and is otherwise in compliance with the license. See: http://creativecommons.org/licenses/by-nc/2.0/ and http://creativecommons.org/licenses/by-nc/2.0/legalcode.
Statistics from Altmetric.com
Introduction
Amplified by global warming, there is growing resolve to limit the public health impacts of exposure to hot weather. Recent catastrophic events have brought the health risks of heatwaves into public and media attention.1 2 However, given recognition that even moderately warm temperatures can be associated with adverse health impacts and that theoretically preventable heat-related deaths may occur throughout the summer, several ecological studies have been conducted in recent years to characterise the temperature-mortality relationship apparent in populations during typical summer months. Arguably there is now enough evidence to characterise this general temperature-mortality relationship observable in communities in a variety of settings across the world.
The aetiological link between deaths on hot days and heat exposure can be difficult to establish, and deaths attributable to heat-related causes may therefore be underestimated.3 Heat exposure can exacerbate a range of other medical conditions and so, other than heat-stroke and hyperthermia, deaths from many other causes may also rise during hot weather. Deaths from cardiovascular and respiratory disease are commonly reported as the underlying cause of death during heatwaves, and, to avoid misclassification, epidemiological studies assessing heat impacts often use all-cause mortality as the outcome measure.
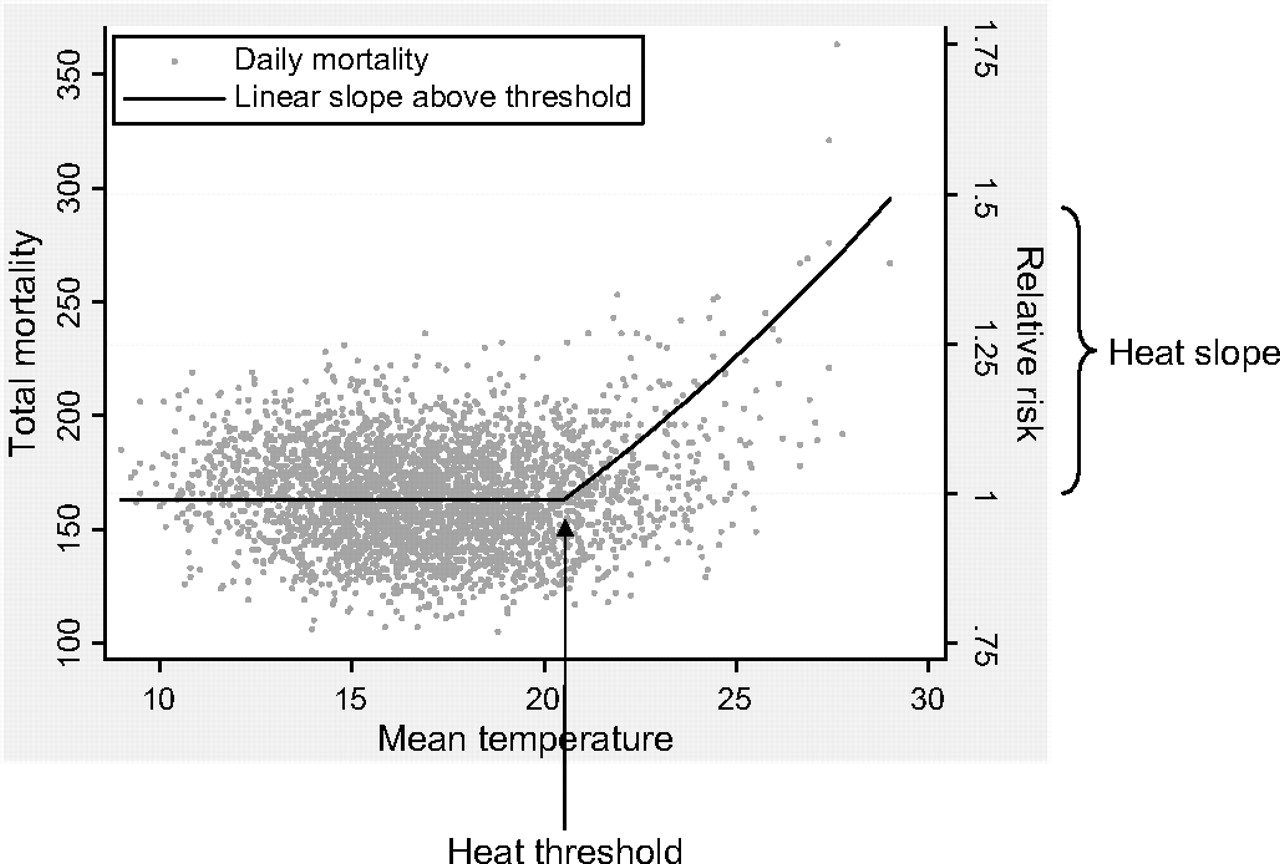
Epidemiological studies that estimate the heat-mortality function observable at a community-level commonly use routinely collected data and aim to measure short-term (day-to-day) associations between daily mortality counts and ambient temperature levels after controlling for confounding factors. In general, such studies are often interested in estimating two parameters as measures of vulnerability of a population to heat: the heat threshold indicates the value of temperature above which heat effects may be observed in some (the most sensitive) people in the population, and the heat slope as a measure of effect size. Figure 1 shows the typical relationship observed between days of mortality and summertime temperature in populations with a temperate climate, in this case London, UK,4 with a well-defined value of temperature above which mortality risk begins to rise (heat threshold) and thereafter a smooth, often linear, increase in risk with increasing temperature (heat slope). Some extremely hot days (especially those occurring during a heatwave) may be associated with mortality greater than predicted by a linear slope, but they will number very few.4

Relationship between daily mortality and summertime daily mean temperature in London, 1976–2003.
Both the threshold and slope are likely to vary considerably across populations depending on differing climatic, demographic and socioeconomic profiles. For example, as well as individual risk factors such as advanced age, contextual factors such as social contact and the built environment may also modify risk.5 Public health protection measures are being increasingly employed to minimise heat risk. Common among these are heat-health warning systems, which trigger short-term interventions in response to weather forecasts.6 7 Greater understanding of the specific determinants that explain heterogeneity in heat risk will ensure appropriate development of such targeted interventions and provide insight into future vulnerability expected in a warmer world.
Among the factors likely to contribute to current and future vulnerability is urbanisation. It is recognised that the dangers of heat exposure are likely to be amplified in heavily built-up areas due to increased thermal storage capacity and night-time radiation. Consequently, in an increasingly urbanised world, it is expected that populations in cities will carry the biggest burden from heat stress.8 9
Using published estimates of population-level vulnerability to ambient temperature, this essay reviews the heat–mortality relationship observed in cities throughout the world. The aim is to explain between-city differences in risk in relation to a variety of climatic, demographic and socioeconomic parameters measured for each population.
Methods
Search strategy and selection criteria
The following databases were searched in any language: MEDLINE (1950-present) and EMBASE (1974-present). The MeSH term ‘Weather’ was used in combination with the MeSH term ‘Mortality’. Reference lists of all relevant studies were also inspected to identify any further studies. Details of the search strategy are provided in figure 2.

Literature search strategy.
Only studies which applied time-series regression or case-crossover methods of analysis were considered. Both designs are currently deemed appropriate approaches to estimate short-term heat effects, and provide comparable results.10 Studies included were those that were conducted on multiple cities, that analysed mortality on a daily resolution and provided an estimate of the heat slope and threshold, or the heat slope observed during summer months. In addition, single city studies providing the same information were also retained if the study location was not broadly represented by any of the multicity papers. On the rare occasions where the same location appeared in more than one multicity paper, the estimates were taken from the study that analysed the longer mortality series. The few studies on morbidity outcomes were not considered as impacts have been observed to be inconsistent and generally not as large as with mortality.11–15 Studies that analysed only defined periods of exceptionally high temperature (‘heatwaves’), rather than general summertime heat, were excluded as such episodes are unique events and therefore not readily comparable.
For all retained studies, heat slopes and thresholds observed for all-cause, all-ages mortality were extracted wherever possible. In studies not restricted to summer months, heat thresholds were most commonly estimated using goodness-of-fit of statistical models, or otherwise were determined based on percentiles or absolute values of the temperature distribution. It is important to stress that estimates are from population-based studies, and so do not provide information on individual risk. Wherever possible, estimates were based on same-day temperature exposure only (lag 0), which in most cases would be expected to capture the majority of the heat impact.
Then, in order to explore heterogeneity of effects, a random-effects meta-regression was applied to the heat slopes in relation to a number of standardised city-level characteristics. These were measures of climate, demography and economy, and were derived from the following sources: World Climate,16 World Gazetteer,17 World Health Statistics,18 The UN-HABITAT Urban Indicators Database,19 World Health Organization (WHO) ‘Healthy cities project’,20 European Foundation urban indicators,21 City Mayors statistics,22 MERCER Consulting quality of living survey,23 Economic Intelligence Unit's Global liveability rankings,24 and the 2008 SustainLane US city rankings.25 For nine Californian counties identified in one study, city-level information from representative cities was used, and for the Netherlands effect estimate obtained from another study, city-level information from Amsterdam was used. Meta-regression analysis was conducted in STATA 10.1.
Results
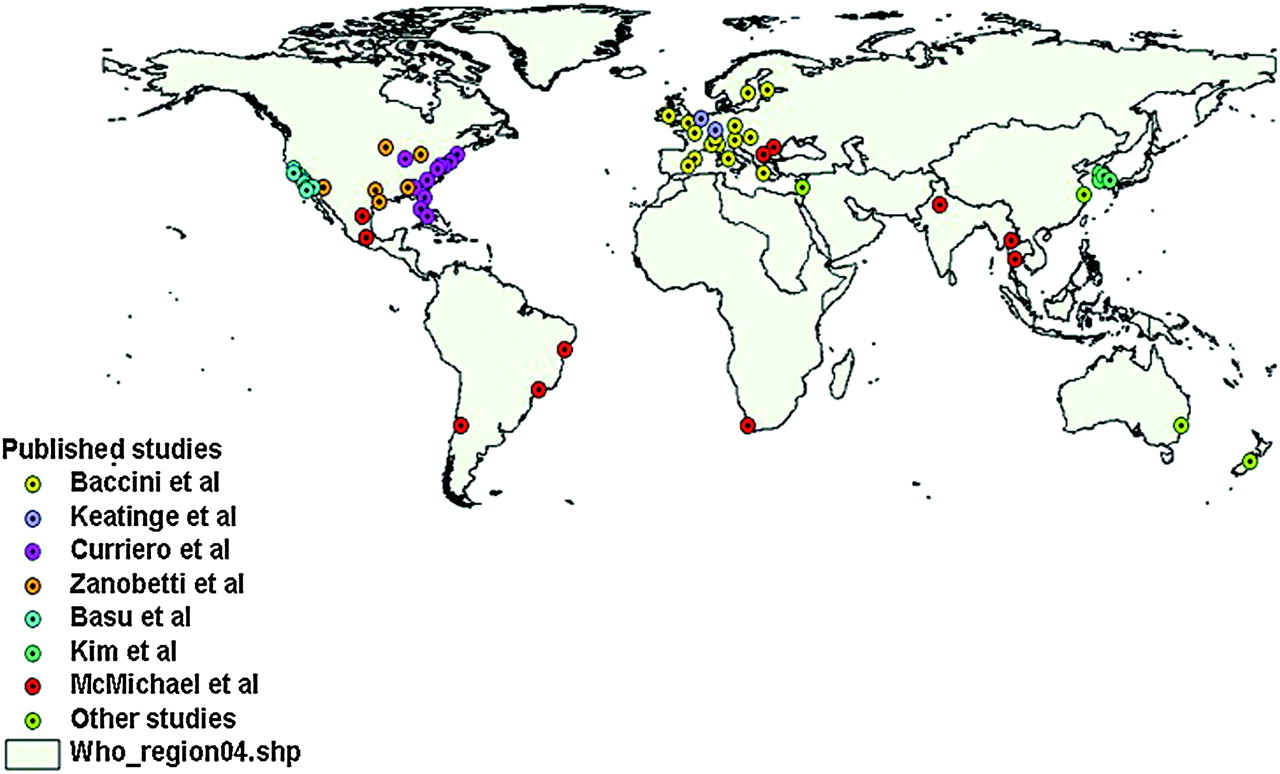
Seven studies were identified that were multilocation and provided estimates of heat slopes above a threshold (or above the lowest temperature value within the summer months).26–33 Most evidence to date is based on North American and European populations (figure 3). In order to further extend geographical coverage, single site studies from the following locations were also included: Sydney, Australia34; Christchurch, New Zealand35; Shanghai, China36; and Beirut, Lebanon.37 In total, heat slopes from 64 locations in six continents were considered.

Study locations.
Heat slopes and thresholds were provided in terms of daily mean or daily maximum temperature, or daily mean or daily maximum apparent temperature, which is an index measure of temperature and high humidity.38 Table 1 summarises the main results from each study. Estimates from the Keatinge et al study were based on all-cause mortality in age group 65–74 years only.26
Summary of papers reviewed
In general, higher heat thresholds (based on either mean or maximum measures) were observed in populations with higher summertime temperatures. This is also reflected in higher thresholds occurring in populations closer to the equator - figure 4 shows the pattern of heat thresholds with latitude for studies measuring mean temperature. Similar patterns were also observed in the studies using any one of the other temperature measures.

Relationship between heat threshold and latitude for studies measuring mean temperature.
In terms of heat slopes, published estimates ranged from no evident heat effect in Dublin (Ireland), Dallas and Charlotte (USA), and Busan (South Korea), to a 12.3% (95% CI 5.7 to 19.4) increase in mortality per 1°C increase in high temperature in Beirut (Lebanon) and 18.8% (13.0 to 25.0) in Monterrey (Mexico), with both cities having correspondingly high heat thresholds. The heat slope in Seoul was considerably larger than for the other cities in South Korea. In almost half of all locations studied, heat slopes were estimated to be between 1% and 3% per 1°C change in temperature. It is noteworthy that even in Helsinki and Stockholm, cities that experience relatively cool summers, there was a clearly defined heat threshold and slope. Heat slopes were appreciably lower in the US-based Zanobetti et al and Basu et al studies. In part, this may be because these estimates were based on temperatures observed throughout the summer months (May–September) rather than above a heat threshold. In both studies, however, the slope estimate remained largely unchanged in sensitivity analyses limited to higher temperatures.30 31
In meta-regression models, heat slopes were found to be strongly related to heat thresholds, with larger effects occurring in populations with higher thresholds - p value for trend <0.001 in either studies quoting a mean or a maximum temperature measure. Also related to the slope was the age distribution, with an estimated 0.056% (95% CI 0.001 to 0.111) increase in risk for each percentage increase in those aged 65 years or more in the city. The age coefficient was larger when studies were restricted to either one of the apparent temperature measures. In models controlling for the age distribution, statistically significant associations (p<0.001) were also observed between increasing slope and decreasing healthcare (score out of 100), or increasing slope and increasing population (defined as city population - not urban agglomeration). Both of these associations, however, were rendered non-significant when controlling also for population density (per square kilometre). In the final model, increasing population density, decreasing total gross domestic product (GDP) of city (expressed in US dollars using purchasing power parity exchange rates) and increasing percentage aged 65 or more, were all independently associated with an increase in the heat slope. Broadly similar patterns were observed when models were restricted to studies using only mean temperature, or only mean apparent temperature, or only maximum apparent temperature.
Discussion
Published studies indicate that in many populations ambient heat affects mortality. Such effects occur in a range of geographical settings and in countries of all levels of income. By comparing estimates from studies using broadly similar approaches, it was possible to highlight some important commonalities and differences between the cities studied. For example, heat-related mortality was observed in places already accustomed to high temperatures such as New Delhi,33 as well as in cities with cool summers where annual heat exposure may not perceived to be a problem, such as Helsinki.32 The study by Baccini et al also studied Dublin where no heat effect was observed; this may reflect the fact that Dublin experiences less variation in summertime temperature compared to Helsinki, despite a higher summertime mean.32 Variation in summertime temperature was, however, not found to be a significant predictor of heat mortality across all cities in the current study.
The present study suggests that an ageing population may heighten future vulnerability to heat exposure. During hot weather, older people may become dehydrated, hypernatraemic and have a likelihood of renal failure, with resultant complications of the cardiovascular system.39 They are also more likely to be on medication that may interfere with the normal sweating process and other systems that regulate body temperature. In addition, older people may be at increased risk because they are more likely to live alone and have less social contact.40–42
A previous case-crossover study of 50 US cities found larger heat effects associated with higher population density.43 A similar pattern was observed in the present study occurring on a global scale. In part, this may reflect the higher temperatures experienced in urbanised settings because of greater thermal-storage capacity of heavily engineered environments, poorer ventilation and localised heat sources, such as vehicles and air-conditioning units.44 This process, known as the urban heat island effect,45 may also contribute to greater heat stress by raising night-time temperatures, which in turn limits relief from exposure.46 High settlement density has previously been reported to be correlated with higher temperatures and greater thermal discomfort.47
Lower GDP of a city was associated with higher heat risk. This may reflect technological protection measures such as access to home air-conditioning. Although it was not possible to obtain standardised city-level prevalence of air-conditioning, heat risks were comparatively low or absent in cities from the USA, where air-conditioning use is common. The exception to this was the Curriero study, which analysed older data when home air-conditioning may not have been as widespread.27 28 The same study did report that the percentage of homes with air-conditioners was a significant predictor of the heat slope across their 11 US cities,27 28 and other US studies have also reported the role of air-conditioning in reducing heat risk.48 49 However, air-conditioning use may not be an affordable solution in many poor countries and is itself highly energy-intensive, thereby contributing to further greenhouse gas emissions. Consequently, the role of air-conditioning as part of public health protection strategies may be best focused on communal areas such as publicly accessible cooling centres, rather than in individual homes.
Higher heat thresholds were observed in populations experiencing higher summertime temperatures and also broadly in those closer to the equator. The threshold values, therefore, are a measure of tolerability of a population to its local climate, and differences in thresholds worldwide are likely to reflect a host of behavioural and cultural factors as well as long-term physiological adaptation. Such differences suggest that populations can adapt to changes in climate, and indeed there is epidemiological evidence from some populations that heat impacts have reduced over time, most likely due to benefits of increased societal prosperity such as improvements in healthcare and housing.50 51 However, the rapidity of climate change expected in the coming decades under most scenarios of global warming makes future acclimatisation uncertain. In high-income settings, future vulnerability may also be heightened by a move towards more people living on their own in later life. Limited social contact was a key risk factor for mortality identified during the heatwave episodes of Chicago 1995 and Paris 2003.52 53 In some low-income settings, urbanisation is increasing at a rapid pace and may escalate the problem of heat stress common in most cities. Furthermore, as much of the urbanisation may take the form of informal settlements and slums with accompanying problems of sanitation,33 heat-related infectious diseases may also rise. In such situations, where heat-related mortality is not mainly restricted to exacerbation of chronic diseases in older people as in high income-settings, far fewer of the deaths are likely to be explained by a simple forward displacement (‘harvesting’) of deaths in already vulnerable individuals.54 Consequently, in terms of length of life being shortened, the largest heat burden may fall on the poorest populations, who also have the least economic capacity to adapt.
Some differences in risk across the 64 locations may also be explained by differences in the study periods analysed and slight variations in the outcome and exposure series used. Estimates were based on all-cause all-ages mortality in all cases except the two locations from the Keatinge et al study, which were based on ages 65–74 years only.26 In high-income settings, the majority of heat-related deaths are likely to be classified with an underlying cause of cardiovascular or respiratory disease.55 56 In the present essay, three of the studies made no mention of excluding deaths from external causes. Although there is some evidence that such deaths are sensitive to hot weather,57 they make up only a small percentage of the total mortality profile of a high-income country and so their inclusion is unlikely to impact on estimates greatly. Temperature levels observed on the same day as the day of death were available as the main exposure of interest in all studies except three, where an average of the same day and day before (lag 0–1 days),33 or lags 0–2 days,36 or 0–3 days was used.32 All studies demonstrated heat impacts that were mostly immediate; however, as estimates did not consider possible harvesting of heat deaths (reflected in negative risk at longer lags), the net heat effect is likely to be overestimated in most cases.32 Also, it is important to note that, although cities with heat thresholds at the very high end of their temperature distribution were generally associated with the largest relative risks, they may not necessarily carry the biggest burden attributable to heat as days of such high temperatures will be rare. For example, the largest heat effect was estimated in Monterrey (Mexico) above a threshold of 31°C mean temperature, but on average less than 5% of all days within the year exceed such a value.33
In general, all selected studies used a similar modelling approach and similar levels of confounder control, with only slight variations in terms of model specifications. All studies considered a temperature–humidity index as the exposure of interest, or otherwise explicitly controlled for relative humidity when estimating temperature effects. Unit increases in risk are also unlikely to be substantially dependent on whether a mean or maximum temperature measure was considered.30 Patterns of mortality predictors remained largely the same when regression models were restricted to studies measuring only mean temperature, or only mean apparent temperature, or only maximum apparent temperature. Most studies controlled for air pollution; often this included consideration of particulate pollution,30 31 33–36 or otherwise nitrogen dioxide.32 The Basu et al US-based study reported that heat effects were not confounded or modified by air pollution exposure30; Zanobetti et al did observe some confounding of the heat effect by ozone, but no effect-modification by ozone or fine particulates.31 This topic has received much interest in recent years and several studies in various settings, including the USA, have reported synergistic effects between high temperatures and particulates,58–61 ozone62 and sulphur dioxide.34 It has been argued that any effect-modification may be attributable to seasonal variations in population exposure to pollutants rather than to increased toxicity.63
Although the studies reviewed here provide evidence that heat-related mortality is a regular summertime occurrence, many of these deaths are theoretically preventable and in recent years specific interventions to warn and protect the public from the dangers of hot weather have become more common. Following major heatwave events,1 2 64 many cities in North America and Europe now have heat-plans, including the use of heat-health warning systems (HHWS), where short-term intervention measures are initiated in response to forecasts of hot weather. The most widespread forms of HHWS utilise a synoptic approach, whereby risk is based on a number of weather parameters as they commonly appear within air masses.65 The epidemiological evidence is now building to identify those most at risk during high temperatures.66–70 To date, however, there has been little evaluation of the effectiveness of HHWS and public responses,71–74 but it is likely that they will become more commonplace as similar systems are in development across cities in Australia and Asia. Many of these systems are only designed to be triggered during days of extreme heat so they do not address temperatures at other periods of the summer, which, although more moderate, occur more often and so are responsible for a larger fraction of heat-attributable deaths.4 So in the longer term, it is expected that other forms of interventions will also be necessary in order to reduce the overall summertime burden. General improvements in health and social care of older people in the community may contribute to this. Also needed are more energy-efficient buildings and greater consideration of cooling strategies by city-planners, which minimise the heat island of a city; for example, increased allocation of green spaces and water bodies to cool the built environment, and restrictions on personal transport usage to help reduce anthropogenic heat sources. These may all help to reduce future death tolls attributable to heat, as well as possible health cobenefits arising from reduced air pollution and greenhouse gas emissions, and less reliance on the motor car.
In conclusion, populations from many cities around the world already experience a considerable burden from heat-related mortality and may become more vulnerable in future due to climate change, urbanisation and population ageing. Measures designed to minimise heat islands in cities, to keep building interiors cool and to improve the general care of older people, are likely to play a key role alongside HHWS in reducing future impacts.
What is already known on this subject
Heat-related deaths occur during heat-waves but also less noticeably at other times of the summer.
What this study adds
Heat-related mortality impacts occur in a range of geographic settings and in all countries of all levels of income.
Some heterogeneity in heat-risk between populations can be explained by population density, GDP and the age distribution.
Policy implications
Measures designed to minimise heat islands in cities, to keep building interiors cool and to improve the general care of the elderly are likely to play a key role in reducing future heat burdens.
References
Footnotes
Funding SH is funded by a Wellcome Trust Research Career Development Fellowship (076583/Z/05/Z) TK is funded by the British Columbia Centre for Disease Control.
Competing interests None.
Provenance and peer review Not commissioned; externally peer reviewed.