Article Text

Abstract
Background Currently available tools for identifying individuals at high risk of type 2 diabetes can be invasive, costly and time consuming. This study aims to develop and validate a self-assessment tool for identifying individuals at high risk of type 2 diabetes in the Chinese general population.
Methods A cross-sectional survey was conducted from 2000 to 2001 in a nationally representative sample of 15 540 Chinese adults aged 35–74 years. The diabetes risk level (DRL) was assessed by classification and regression tree (CART) analysis using four predictors: age, body mass index, waist–hip ratio (WHR) and waist circumference (WC).
Results The significant predictors for type 2 diabetes were WHR and age for women and WC and age for men. The categories generated by CART analysis stratified women into eight DRL and men into five DRL. The prevalence of type 2 diabetes increased with the increase in DRL in both women and men. A DRL of 6 or greater predicted type 2 diabetes status with a sensitivity of 0.61 (95% CI 0.55 to 0.67), a specificity of 0.71 (95% CI 0.70 to 0.73) in women, and a DRL of 3 or greater predicted type 2 diabetes status with a sensitivity of 0.59 (95% CI 0.52 to 0.65) and a specificity of 0.63 (95% CI 0.62 to 0.65) in men.
Conclusions This study demonstrates that application of the DRL has identified a substantial proportion of individuals with type 2 diabetes in the Chinese general population. It suggests that there is a great potential for applying the self-assessment tool in healthcare-limited settings.
- diabetes risk level
- predictor
- type 2 diabetes
- AUC, area under the receiver operating characteristics curve
- CART, classification and regression tree
- DRL, diabetes risk level
- NPV, negative predictive value
- PPV, positive predictive value
- WHR, waist-hip ratio
- WC, waist circumference
Statistics from Altmetric.com
- AUC, area under the receiver operating characteristics curve
- CART, classification and regression tree
- DRL, diabetes risk level
- NPV, negative predictive value
- PPV, positive predictive value
- WHR, waist-hip ratio
- WC, waist circumference
The rising prevalence of type 2 diabetes has a become major public health problem worldwide, and it has been predicted to affect 366 million people by the year 2030, of which at least 40 million people would be from China alone.1 Approximately a 1% increase in the prevalence of type 2 diabetes will result in one million more patients in China, which imposes a massive socialeconomic burden on the community.
Studies have reported that type 2 diabetes is associated with a number of genetic, environmental and lifestyle factors.2–7 Recent intervention studies have also clearly shown that type 2 diabetes could be prevented or delayed through simple lifestyle modification among high-risk individuals.8–10 Therefore, the earlier detection of individuals at high risk of type 2 diabetes is a high priority for primary prevention. However, currently available screening tools for identifying individuals at high risk of type 2 diabetes can be invasive, costly and time consuming.11–18 Furthermore, most diabetes risk scores have been developed in western populations,11 13–15 17 19 20 south Asian12 18 21 22 and Arab populations23 with application in clinical practice/primary care services.15 17–19 Such predicting tools are lacking in the Chinese population. We also note that different risk scores are not extrapolated across populations.20 In addition, some of these risk scores used laboratory tests and required a history of medication,12 13 15 16 18 which limited their use in China due to limited healthcare resources, especially in private-financing healthcare services.24 Easy self-assessment anthropometric measures have been suggested to be good indictors for type 2 diabetes in different populations,25 and might be used as alternatives for developing screening tools.
So far, no screening tool for type 2 diabetes has been reported in the Chinese population, which results in a large proportion of undiagnosed type 2 diabetes in China.26 In the current study, we aim to develop and validate a self-assessment tool for identifying individuals at high risk of type 2 diabetes in the Chinese general population.
Research design and methods
Study population
Our analyses are based on data collected from the International Collaborative Study of Cardiovascular Disease in Asia (the InterASIA) conducted in China. The method of this study has been described in detail elsewhere.25–28 In brief, a four-stage stratified sampling method was used to select a nationally representative sample of the general population in China from 2000 to 2001. A total of 19 012 persons was randomly selected from 20 primary sampling units (street districts in urban areas or townships in rural areas). Of the 19 012 persons, 15 838 participants (15 540 participants aged 35–74 years) completed the survey and examination (response rate 83%). The current study included 994 persons with type 2 diabetes and 13 129 persons with normal fasting glucose aged 35–74 years. Participants with impaired fasting glucose (n=1121) and those with missing fasting glucose measurements (n=296) were excluded from this analysis.
The InterASIA study was approved by the Institutional Review Board at the Tulane University Health Sciences Center and the ethics committee and other relevant regulatory bodies in China. Informed consent was obtained from each participant.
Data collection
Data collection was conducted in examination centres at local health stations or community clinics by trained research staff using a standard questionnaire. Information included age, gender, self-reported history of diabetes and the previous diagnosis and treatment of diabetes.
Anthropometric measurements
Body weight, height, waist circumference (WC) and hip circumference were measured by trained observers according to a standard protocol in the InterASIA.26 Body mass index (BMI) was calculated as weight (in kilograms) divided by height (in metres) squared. Waist–hip ratio (WHR) was calculated as WC divided by hip circumference.
Laboratory measurements
Blood specimen samples were obtained to determine plasma glucose after at least 12 h of fasting and were collected by the use of vacuum tubes containing sodium fluoride. The serum glucose level was measured by using the modified hexokinase enzymatic method (Hitachi automatic clinical analyser, model 7060, Japan).
Participants without a previous diagnosis of diabetes were categorised according to the American Diabetes Association diagnostic criteria as follows: undiagnosed diabetes (fasting glucose ≥7.0 mmol/l) and impaired fasting glucose (6.1–6.9 mmol/l).29 Diabetes was defined as a self-reported history of diabetes plus undiagnosed diabetes. Obesity was defined as a BMI of 28 kg/m2 or greater, overweight was defined as a BMI of 24 or greater but less than 28.30
Data analyses
Analysis was conducted in women and men separately. Before building models, the dataset was randomly split into two subset samples, 50.2% (n=7083) of the data for the training sample and the remaining 49.8% (n=7040) for the testing sample. Continuous variables were expressed as median (25th percentile, 75th percentile) and categorical variables as n (%). The χ2 test was used to analyse categorical data. Differences in continuous variables were evaluated by the Mann–Whitney Wilcoxon test. Classification and regression tree (CART) analysis was used to develop a simple self-assessment tool for identifying individuals at high risk of type 2 diabetes. This procedure repeatedly partitioned the data to create subgroups with highly homogenous outcomes.31 CART constructs a tree that will separate the data in the ‘best’ way by finding binary splits on variables; finds the best splitting variable and the best splitting point at each stage. The decision rule was determined by the Gini criterion, a measure of variability within the new subgroups.32 The target variable has a value of 0 or 1 depending on diabetes status (0 if absent, or 1 if present). The explanatory variables selected to predict the risks of type 2 diabetes consist of four easily attainable self-assessment continuous variables (age, BMI, WC and WHR). Nodes in the CART analysis were constrained to have a minimum size of 400 records in parent nodes and 200 records in final child nodes. The proportion of subjects having type 2 diabetes was reported in each node of the tree. A risk stratification system (diabetes risk level; DRL) was developed based on the final child nodes in CART analysis.
A multivariable logistic regression model including the same predictors was also developed. The predictive performance of CART analysis was evaluated by using the area under the receiver operating characteristics curve (AUC), sensitivity, specificity, the positive predictive value (PPV) and the negative predictive value (NPV).
All analyses were performed using STATA version 9.2 except the CART analysis was conducted using the SPSS 16.0 statistical software package. A p value less than 0.05 was considered statistically significant.
Results
Comparison of the characteristics of the 7083 participants used to develop the model (training sample) and the 7040 participants used to test the model (testing sample) are shown in table 1. The training sample and the testing sample were similar with respect to age, WHR, BMI, WC and the prevalence of type 2 diabetes. The overall prevalence of type 2 diabetes was 6.4% (95% CI 5.8% to 6.9%) and 6.7% (95% CI 6.1% to 7.3%) for women and men, respectively.
Sociodemographic and clinical characteristics of study participants in the training sample and the testing sample, by gender
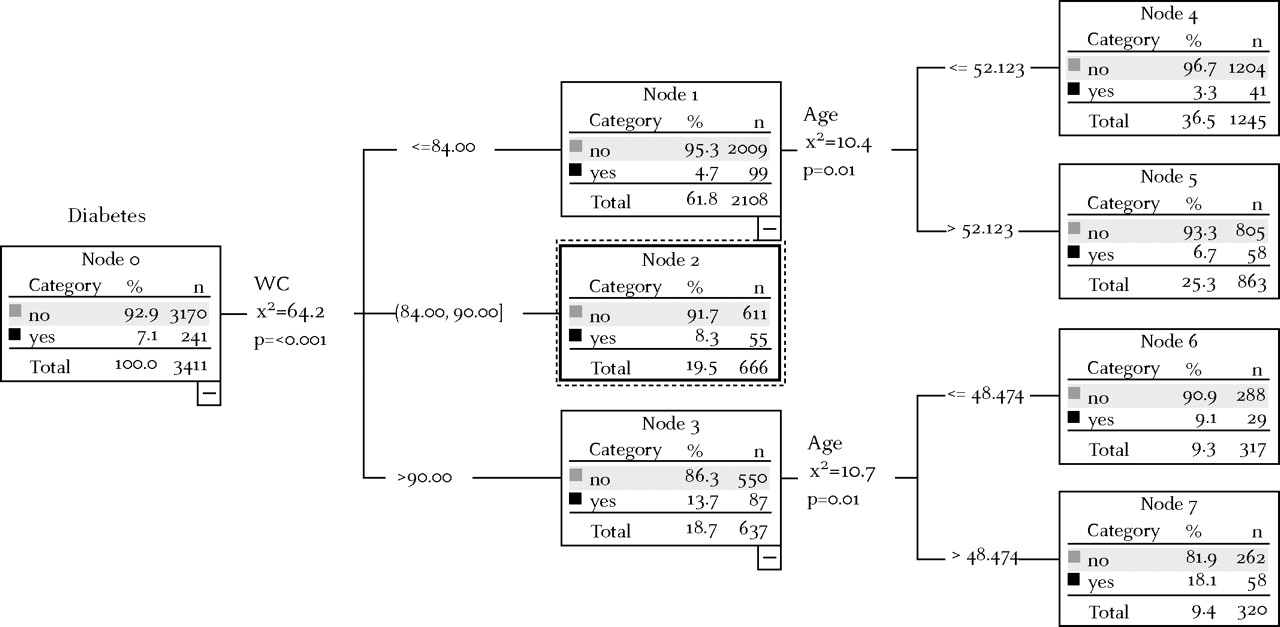
Figures 1 and 2 depict the classification tree along with the prevalence of type 2 diabetes in each child node. Of the four common easily known predictors (age, WHR, WC and BMI), WHR and age were selected by the CART analysis for women, whereas WC and age were selected for men. WHR was proved to be the best predictor for women (χ2=149.6, p<0.001) and WC for men (χ2=64.01, p<0.001). Age was the second most important predictor for type 2 diabetes in both women and men, respectively.
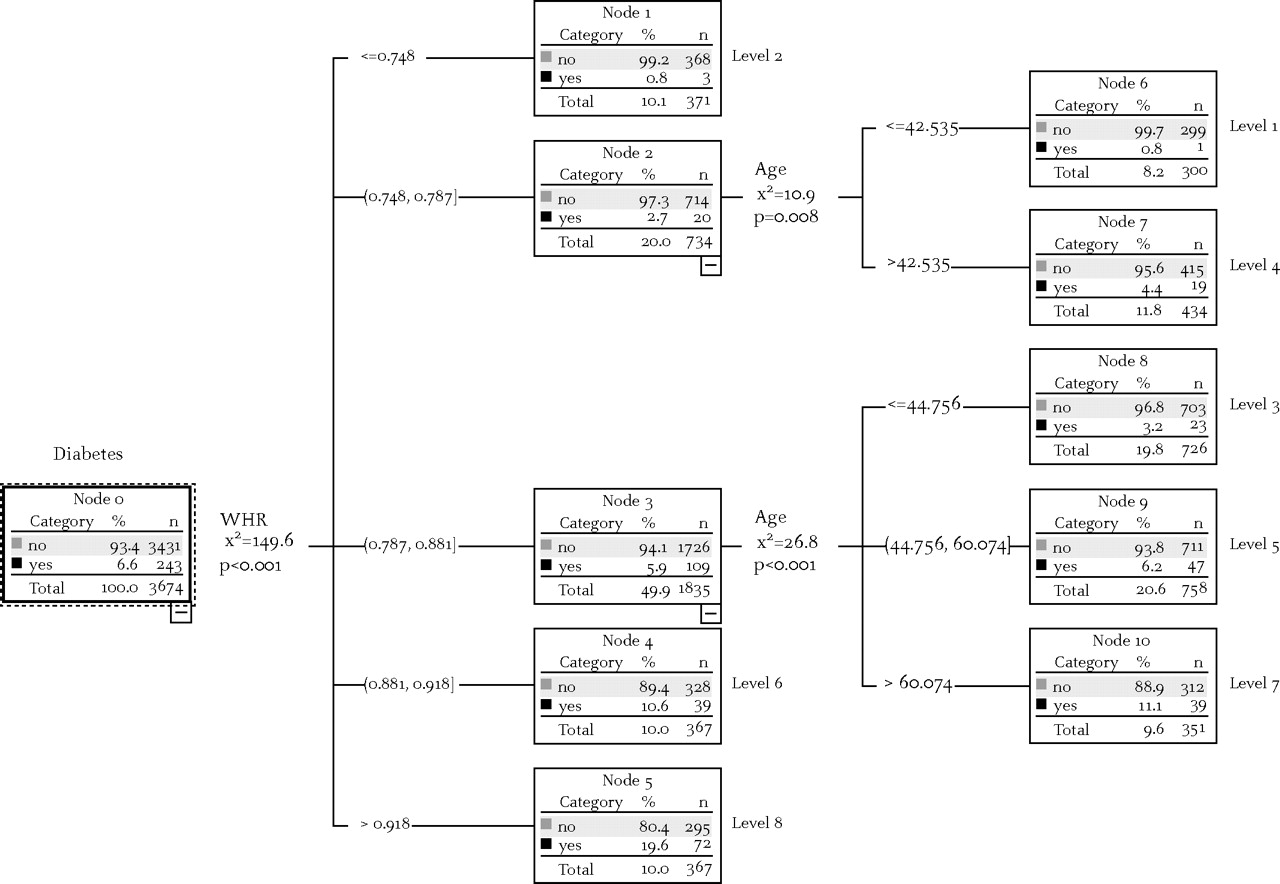
Predictors of type 2 diabetes and risk stratification by classification and regression tree analysis for women in the training sample. WHR, waist–hip ratio.

Predictors of type 2 diabetes and risk stratification by classification and regression tree analysis for men in the training sample. WC, waist circumference.
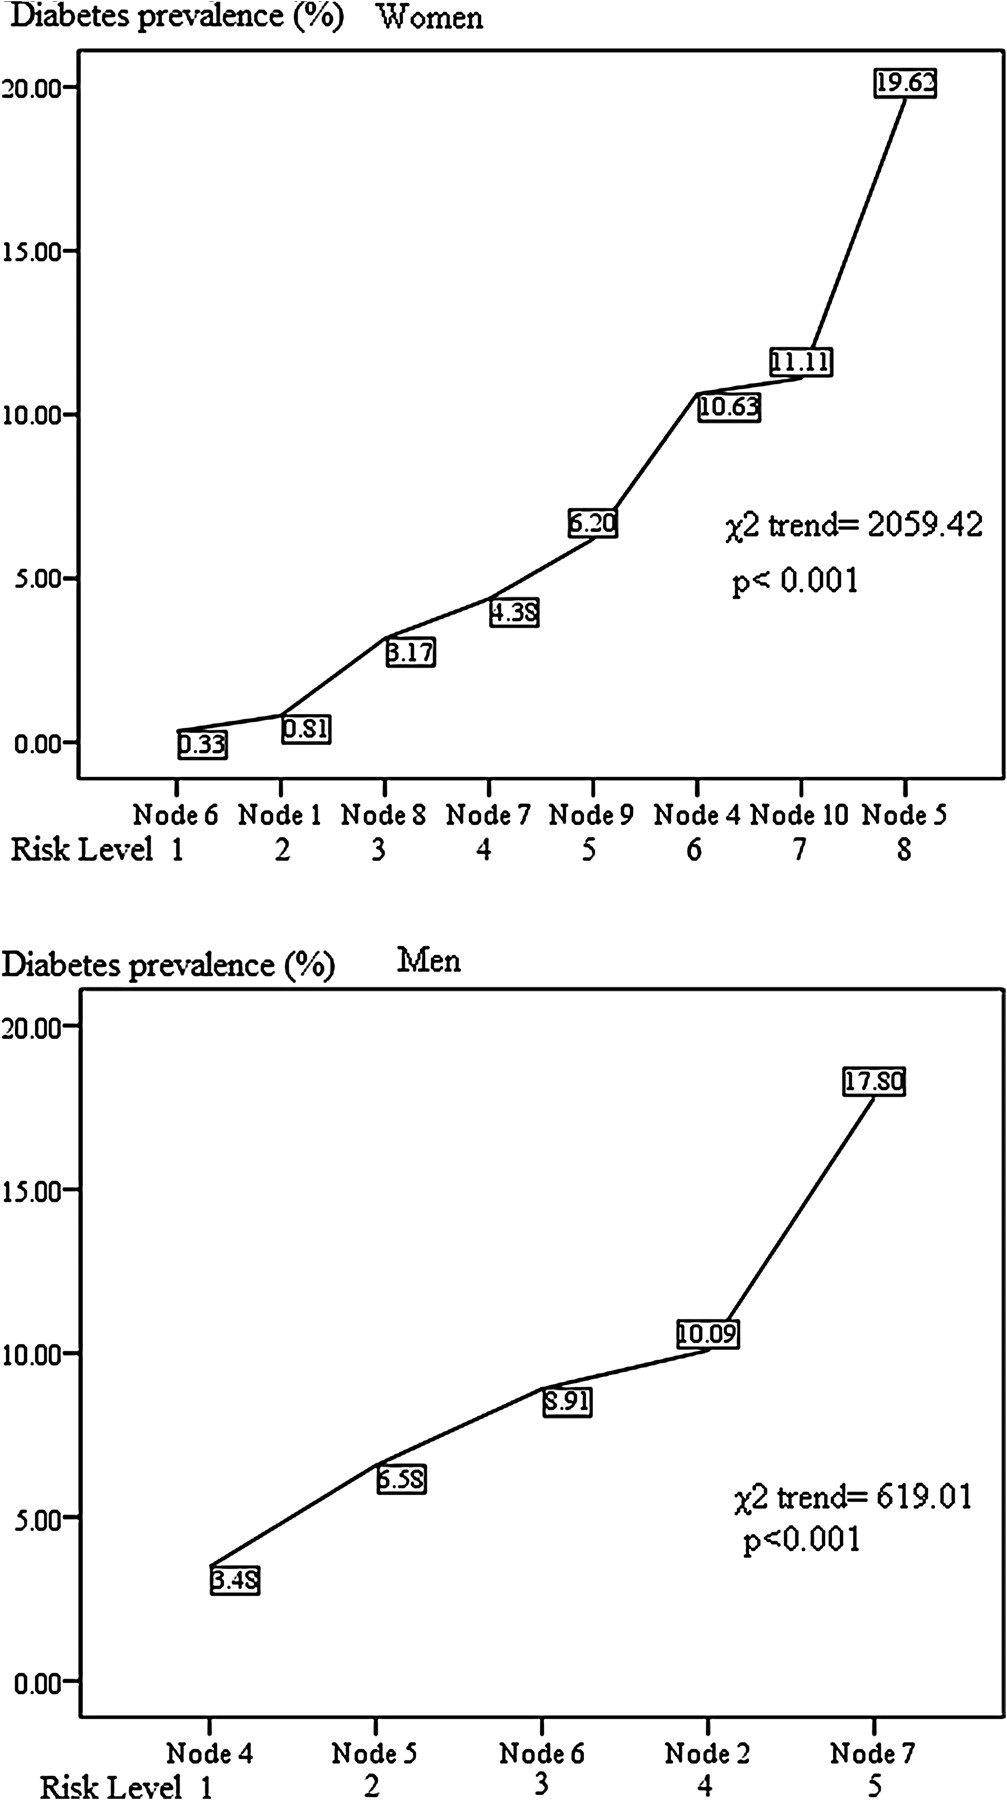
The final child nodes generated by CART analysis stratified women into eight DRL and men into five DRL (figures 1 and 2). The prevalence of type 2 diabetes increased with the increase in DRL in both women and men, as shown in figure 3 (women χ2trend=2059.42, p<0.001; men χ2trend=619.01, p<0.001). Women with a DRL of 8 (WHR >0.918) and men with a DRL of 5 (WC >84 cm) are at the highest risk of type 2 diabetes.

Type 2 diabetes prevalence rates of subgroups with different diabetic risk levels developed by classification and regression tree analysis in women and men.
Sensitivity, specificity, PPV, NPV and likelihood ratios that predict the presence of type 2 diabetes for a threshold are shown in table 2. A threshold DRL of 6 or greater in women identified 62% of individuals with type 2 diabetes with a specificity of 72%, and a threshold DRL of 3 or greater in men identified 60% of individuals with type 2 diabetes with a specificity of 63%.
Diagnostic statistics of the DRL for identifying type 2 diabetes in women and men
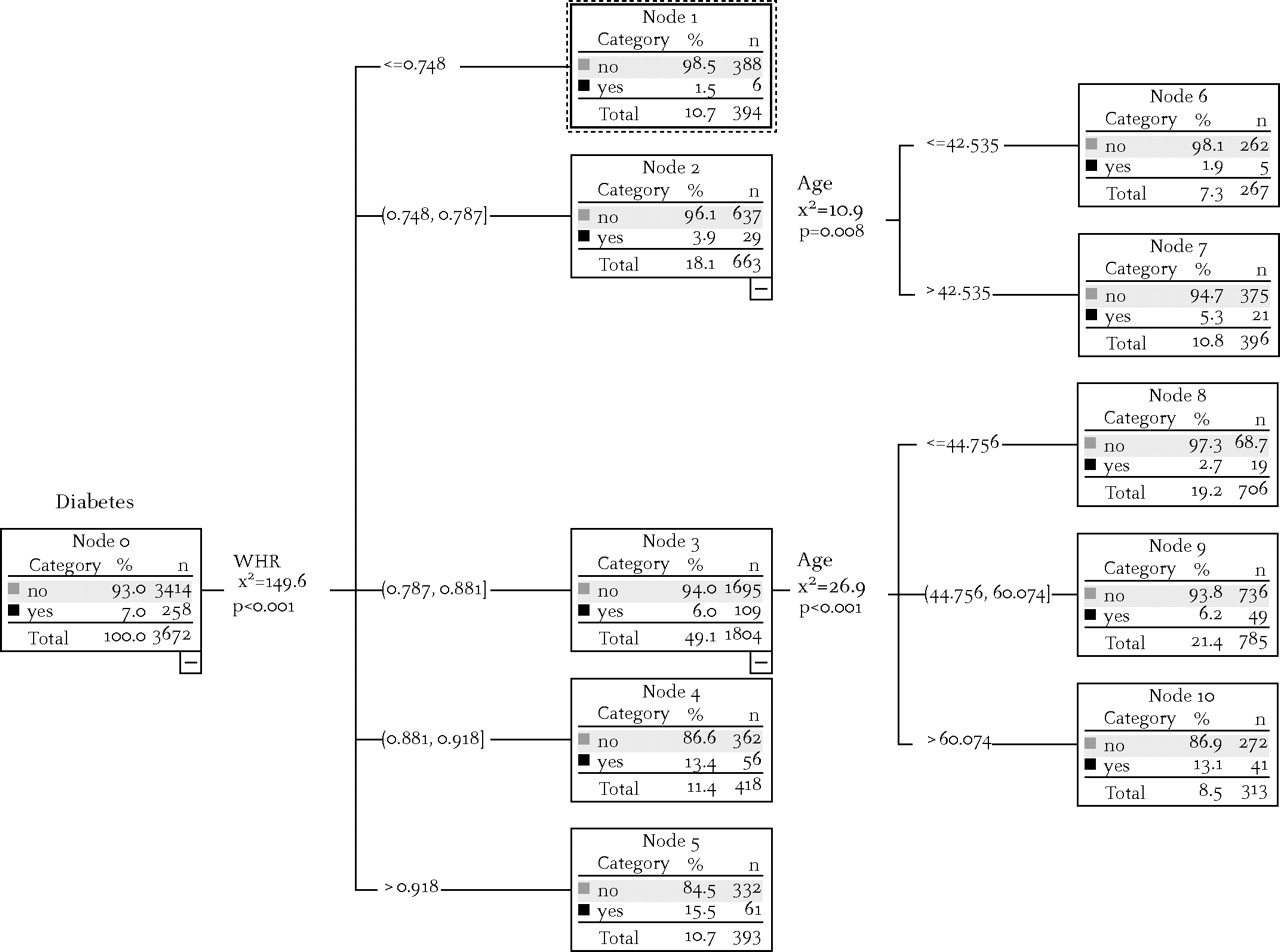
The CART analysis was able to stratify similar results in both training and testing samples (figures 1, 2, 4 and 5). The AUC in the training sample were not significantly different from those in the testing sample for both women and men (women 0.71 vs 0.73; men 0.65 vs 0.69), indicating a good prediction above chance. Other diagnostic statistics were also similar in the two samples (table 2).

Predictors of type 2 diabetes and risk stratification by classification and regression tree analysis for women in the testing sample. WHR, waist–hip ratio.
Predictors of type 2 diabetes and risk stratification by classification and regression tree analysis for men in the testing sample. WC, waist circumference.
Multivariable (age, WHR, WC and BMI) logistic regression analyses show that age, WC and WHR were associated with type 2 diabetes in women (p=(1+e−(0.048 Age+0.020WC+4.01WHR))−1, and age, WC, WHR and BMI in men (p=(1+e−(0.033 Age+0.019WC+3.691WHR+0.043BMI))−1. There was no difference of AUC between CART analysis and the logistic regression model (data not shown).
Discussion
In this study, a self-assessment tool with two simple predictors to identify individuals at high risk of type 2 diabetes was developed and successfully validated by CART analysis in a Chinese general population. The final child nodes generated by CART analysis stratified women into eight DRL and men into five DRL. Nearly two-thirds of individuals with type 2 diabetes have been identified with a reasonable specificity.
As a developing country, the cost on primary care has already been a colossal burden in China. Moreover, awareness, treatment and control of diabetes are relatively low among Chinese adults.28 Therefore, it will be of great value to develop a simple tool for identifying individuals at high risk of type 2 diabetes. To the best of our knowledge, no screening tool for diabetes has been developed previously in the Chinese population. As the DRL generated by CART analysis in this study can be easily applied in the general population and can identify individuals with diabetes, there is great potential for its application in primary care settings in resource-limited countries.
The predictive performance and discriminative ability of this simple tool is highly comparable to those diabetes risk scores that are composed of different sets of clinical variables.11 13 14 17 18 The AUC of DRL generated by CART analysis in our study is similar to those in Indian (AUC 0.73),18 Thai (AUC 0.74)12 and Danish (AUC 0.76)14 studies. However, those diabetes risk scores included at least four variables and also required medical information. Even higher AUC (Germany 0.84; USA 0.85; UK 0.80; USA 0.82, Spain 0.83 for men, 0.87 for women; and middle east 0.83) have been reported if more risk factors are included, such as smoking, alcohol consumption and biochemical tests.11 17 19 23 It is well known that the more variables included in the prediction tool, the less applicable it is to the general population. Given that diabetes could be prevented or delayed by changing lifestyle and physical activity patterns, it seems more sensible to target individuals at high risk by a simple programme that could be run easily in the general public.
The DRL in this study is very simple and also relatively easy to interpret. Compared with other diabetes risk scores, this DRL has a moderate sensitivity and a similar PPV (11–14%),11 14 15 but a high NPV (95–96%). For identifying individuals with diabetes, the DRL has a sensitivity of 61% with a specificity of 71% in women and a sensitivity of 60% with a specificity of 63% in men. According to NPV, individuals with lower DRL are unlikely to have diabetes (approximately 95% probability). This DRL emphasises people with obesity, especially older people (women >60 years and men >50 years). Women with a DRL of 8 (WHR >0.918) and men with a DRL of 5 (WC >84 cm) will then need further blood tests and a suggestion to change to a healthier lifestyle for primary prevention. This information is very important for both the individuals and the health workers when making plans for action.
CART analysis has been proved to perform better than a logistic regression model in developing diabetes risk scores.11 In the current study, CART analysis provided similar results to multiple logistic regression models in terms of sensitivities, specificities and AUC. The results of CART analysis also confirmed that central adiposity (eg, WHR and WC) are better predictors of type 2 diabetes than overall obesity (BMI), which is consistent with previous studies.25
There are several advantages of the DRL. First, it is developed in a representative general Chinese population. Our study employed a multistage stratified random sampling method to select a representative national sample from the Chinese general population. Second, the development and validation of the model in two separate groups (randomised split sample) is an important strength, which lends support to the robustness and generalisability of the results. Third, the final model is quite simple, with only two items in a classification tree form. Compared with other diabetes risk scores derived from more variables and also including a blood test for glucose,11 12 13 14 17 the DRL can easily be applied at home in the general population. Although adding laboratory results would be more predictive, they were not available in the general public and, thus, were not included in our analysis. Our goal in this study is to develop a parsimonious tool, and not primarily to maximise prediction. Potential limitations of the current analysis must be addressed. First, the association between the independent variable and type 2 diabetes may not be causal given the cross-sectional nature of the current study. Second, our study did not include a younger age group.
Conclusion
The CART-based analysis in the current study has created a simple robust tool with considerable discriminative ability and is easy to apply in the general public. We strongly believe that the public health implications of this decision tree are considerable. It is a cost-efficient and practical tool to identify individuals at high risk of type 2 diabetes in the general population and also to offer a chance for early prevention measures.
What is already known on this subject
Type 2 diabetes is associated with a number of genetic, environmental and lifestyle factors and could be prevented or delayed through simple lifestyle modification among high-risk individuals.
Current available screening tools for identifying individuals at high risk of type 2 diabetes can be invasive, costly and time consuming.
A screening tool for type 2 diabetes is lacking in the Chinese population.
What this study adds
The present study used two easy self-assessment anthropometric measures (WHR and age for women and WC and age for men) to generate a new tool for identifying individuals at high risk of type 2 diabetes.
This quick self-assessment tool has identified a substantial proportion of individuals with type 2 diabetes in the Chinese general population.
Acknowledgments
The authors would like to thank Dr Cong Sun from the Centre for Eye Research Australia, University of Melbourne, for reading this paper.
References
Footnotes
Funding The InterASIA study was funded by a contractual agreement between Tulane University, Los Angeles, USA, and Pfizer Inc, New York, USA. Several researchers employed by Pfizer Inc were members of the study steering committee that designed the study. However, the study was conducted, analysed and interpreted by the investigators independently of the sponsor.
Competing Interests None.
Ethics approval The InterASIA study was approved by the Institutional Review Board at the Tulane University Health Sciences Center and the ethics committee and other relevant regulatory bodies in China.
Patient consent Obtained.
Provenance and peer review Not commissioned; externally peer reviewed.