Article Text

Abstract
Background Many problems concentrate in deprived neighbourhoods, among which is poor health. One possible way to address these health problems is to invest in the green space in deprived neighbourhoods. The number of evaluations of the public health impact of actual changes in neighbourhood green space is still limited. This study investigated the impact of real-life changes in the quality or quantity of green space in severely deprived neighbourhoods on physical activity and perceived general health.
Methods Repeated cross-sectional surveys from 2004 till 2011 yielded self-reported information on leisure time walking, cycling and sports, and perceived general health of 48 132 adult residents. We fitted generalised mixed models to assess the rate of change per half year, estimate the linear trend, and the change in trends before and after the start of the urban regeneration mid-2008. Using a quasi-experimental design, we compared the trends in the intervention neighbourhoods with different selections of control areas.
Results The deprived neighbourhoods that intervened in green space did not show more favourable changes in the trend of physical activity and good general health compared to all the different groups of control areas.
Conclusions We did not observe short-term positive effects on physical activity and general health among adults from improvements in green space in deprived neighbourhoods. This suggests that greening interventions that have been carried out in the context of the Dutch District Approach did not achieve short-term health gains among adults.
- EFFECTIVENESS
- Neighborhood/place
- PHYSICAL ACTIVITY
- SELF-RATED HEALTH
Statistics from Altmetric.com
Introduction
Many problems concentrate in deprived neighbourhoods, among which is poor health. One possible way to address these health problems is to invest in the green space in deprived neighbourhoods. Reviews suggest that green spaces might be associated with better health.1–3 Recent individual studies present conflicting or inconclusive results. In Canada and the UK, green environments have been associated with reduced mortality, irrespective of the neighbourhood deprivation level4 ,5 but this was not replicated in a similar, though ecological, study carried out in the USA.6 Better mental health has been reported in greener neighbourhoods;7–9 however, this relation has been refuted as well.10 ,11 Greener neighbourhoods have been associated with less cardiovascular disease in New Zealand,8 but not in Australia.12 In the Netherlands, self-reported general health was associated with streetscape greenery,7 but not with the amount of green space within a 1–3 km radius.10
Another hypothesis states that green space offers opportunities for physical activity or exercise, reducing obesity and health problems. While it seems common sense that green space facilitates physical activity, reviews conclude that the evidence remains weak and effect sizes small.2 ,3 ,13 ,14 Also more recent individual studies failed to observe an association between streetscape greenery and physical activity,7 or green space and types of physical activity normally associated with green space.15 On the other hand, a study in New Zealand found that physical activity levels were higher in greener neighbourhoods.8
More robust evidence on the public health impact of green space requires the evaluation of actual changes in green space such as park improvements or greening of living areas. Park improvements in deprived neighbourhoods have yielded mixed results with regard to their visitors’ physical activity. A playfield renovation in San Francisco, USA, as well as a park refurbishment in Victoria, Australia, increased the number of physically active visitors.16 ,17 In Southern California, USA, the percentage of residents living around the park who reported regular physical activity declined and health improved in the intervention parks, but the same trend was observed in the control parks.18 Greening of living areas was also reported to have mixed effects. Greening of vacant urban spaces in Philadelphia, USA was, in some sections of the city, associated with less reported stress and more exercise compared to matched control lots in the same part of the city. Greening, however, also led to an increased prevalence of high cholesterol.19 A new greenway to connect the pedestrian infrastructure in a neighbourhood with nearby retail establishments and schools in Knoxville, USA, increased walking and cycling within the experimental neighbourhood compared with socioeconomically matched control neighbourhoods, but did not affect active transport to schools.20 Moving to greener areas in the UK was associated with better mental health, adjusted for area level socioeconomic deprivation; individuals who moved to less green areas first experienced a decline in mental health in the year preceding the move but after the move, this improved and they returned to their initial level of mental health.21
The number of evaluations of actual changes in neighbourhood green space is still limited. The mixed results have prevented the answer to the question whether improvements in green space have the potential to improve public health. This paper reports on a quasi-experimental evaluation of the impact of real-life changes in green space on physical activity and perceived health within the context of area-based initiatives aimed to improve the liveability in severely deprived neighbourhoods.
Methods
The district approach
From mid-2008 until 2012, around €5 billion have been spent to ameliorate problems with employment, education, housing and the residential environment, social cohesion and safety in the 40 most deprived neighbourhoods of the Netherlands.22 The areas were selected using registry-based information on physical and socioeconomic deprivation, as well as residents’ reports on physical and social problems. Each neighbourhood developed an action plan tailored to its specific local problems and needs.
Interventions in green space
At the end of 2011 and in early 2012, we retrospectively collected information on the interventions that had been implemented (description, duration and scale), including interventions in green space. We used standardised questionnaires and face-to-face interviews with local managers.23 This procedure yielded complete information on the implementation of the District Approach in 36 neighbourhoods. Twenty-four neighbourhoods did address green as part of their locally tailored District Approach. One-third of these neighbourhoods started the green interventions in 2008. Another third started in 2009 and the rest later, but all of these had been in place for 1 year or more at the time of the inventory. Most of the interventions were completed by the time of the implementation interviews. Twelve deprived neighbourhoods did not invest in green space. We distinguished between investments in green space that can be utilised by residents for recreation (‘green to be used’) and improvements of the green appearance of the neighbourhood (‘green character’).
Eighteen neighbourhoods improved their green space to be used, in half of the cases in combination with investments in the green character of the neighbourhood. Changes in green space to be used were usually a major change realised through the District Approach in these neighbourhoods. Nine of these neighbourhoods invested in new public parks replacing vacant land, thereby adding new green space. These new parks varied in size from small, so-called ‘stamp’ parks, to multipurpose parks of 250 acres. The other nine neighbourhoods redeveloped and refurbished existing parks by adding more open areas for playing and recreation, as well as improving the paths and tracks (accessibility), drainage (usability), landscaping (attractiveness and safety) and maintenance (safety). These nine neighbourhoods, thereby, improved the accessibility of the existing green space, as well as the quality of the available green space. Other green spaces to be used were (natural) playgrounds, community gardens or fruit orchards, a children's farm, fishponds, public allotment gardens, etc. We refer to box 1 for examples of the neighbourhood interventions in green space to be used.
Examples of interventions in green space to be used by residents in three different intervention neighbourhoods, under the Dutch District Approach, situated both in larger and smaller cities
District Approach intervention neighbourhood 1
A park that was already present—but not much used (mainly for walking the dog)—has been turned into a real park that is used by most residents. The surroundings of a new primary school building have been landscaped for use by various (age) groups, for example, including a turf field. The redevelopment of garden allotments in the neighbourhood improved the green character of that area, the path structure, as well as the connection with public areas. The redevelopment of green strips, in cooperation with residents, resulted in, for example, a bowling alley, public fitness equipment and fruit trees to be used by the residents.
District Approach intervention neighbourhood 2
The existing park has been completely redesigned with greater utility value and more recreational opportunities for all residents. Vacant lots in the neighbourhood have been greened, for example, have been converted into vegetable gardens.
District Approach intervention neighbourhood 3
A large-scale redevelopment of the existing park enabled recreation and the hosting of events. The redevelopment included the digging of ditches, improvement of trails, renovation of the rose garden and development of a playground with water features. The maintenance has been stepped up, including regular pruning, to improve public safety. Elsewhere in the neighbourhood a fishpond has been realised through community participation. One green strip has been cleaned and refurbished. The nature park located next to the neighbourhood has undergone a major redevelopment to increase the biodiversity and quality. The pastures are now grazed, paths have been improved, etc.
Another six neighbourhoods improved their green character by planting flower bulbs in front yards; constructing wall gardens; refurbishing streets, including planting trees and shrubs; installing flower boxes on squares; developing a greenway connecting different places or redeveloping streetscape greenery, such as extra trees along roads or new verges. Half of these neighbourhoods did improve the quality of the existing green character, while the other three added new green to the neighbourhood, thereby increasing the quantity of green.
Selection of control areas
The intervention neighbourhoods each constituted one or more postal code areas.22 We used propensity score matching to select control postal code areas that are similar with regard to their living circumstances, physical and social neighbourhood characteristics and safety (13 indicators) at the start of the District Approach (2008)24–27 (see web appendix). First, we selected areas that had propensity scores in the same range as the intervention neighbourhoods for maximum comparability (narrow definition). Second, to increase the number of eligible control areas and statistical power, we selected 10% of the areas with the highest propensity scores (wide definition). We selected areas that were situated within the same municipality to equalise the impact of municipal policy (wide definition, same municipality). Third, we selected all other areas in the Netherlands for maximum statistical power. Fourth, we compared the intervention neighbourhoods with those 12 deprived neighbourhoods that chose not to intervene in green as part of their locally tailored District Approach.
Study population
Repeated cross-sectional data were collected between 2004 and 2011 as part of the Dutch National Health Interview Survey (HIS). The HIS is carried out throughout the year by interviewing new respondents every month. Respondents of all ages were interviewed at home by using Computer-Assisted Personal Interviewing (CAPI). A written questionnaire was left behind for respondents older than 12 years to ask about more sensitive or detailed topics. Starting in 2010, the HIS employs a mixed-mode design. People are asked to use Computer-Assisted Web Interviewing (CAWI). Non-respondents are approached by telephone for Computer-Assisted Telephone Interviewing (CATI). People who still cannot be reached are approached for a personal interview (CAPI). All respondents of 12 years and older were asked to participate in a second part of the survey. This second survey part could be filled by using internet or a paper questionnaire. The yearly non-response of the first survey part was around 35–40%. Respondents younger than 18 years were excluded from our analyses because we hypothesised that the impact of changes in green space is different for children and adults. The number of respondents aged 18 years or younger did not allow for separate analyses. Analyses were based on 48 132 respondents. Of these, 1018 respondents were living in the 24 intervention neighbourhoods (870 in those 18 neighbourhoods that intervened in green space to be used and 248 in the 6 neighbourhoods that improved their green character) and 229 respondents lived in the 12 deprived neighbourhoods that did not intervene in green space. In total, 1918 respondents lived in the similarly deprived control areas (narrow definition) and 3344 in the deprived control areas (wide definition) and 46 885 in the rest of the Netherlands.
Outcomes
The validated SQUASH questionnaire, included in the second part of the HIS, inquired about the frequency (days per week) and duration (minutes per day) of leisure time used for walking, cycling and sports during ‘a typical week in the past few months’.28 ,29 Total minutes per week spent on physical activity were highly skewed, with almost half of the respondents not engaging in the activities. We, therefore, distinguished between residents who are active at least once a week and residents who are not active (i.e, less than once a week). Sensitivity analyses have found results to be robust against alternative cut-off points, for example, prevalence of residents who were 30 or 60 min active per week.
Self-reported general health was measured asking respondents, during the first part of the HIS, how their health is in general. Possible answers were very bad, bad, fine, good or very good. We have dichotomised these answers into good perceived health (good or very good) and less than good perceived health (fine, bad or very bad).
Analyses
Multilevel analyses were applied to take into account the clustering of individuals within neighbourhoods. We fitted generalised mixed models to assess the rate of change and to estimate the linear trend in the prevalence of physical activity and good general health per half year during the preintervention (January 2004 to June 2008) and postintervention period (July 2008 to December 2011). The change in trend between these two periods was assessed by means of an interaction term between the ‘trend’ and ‘period’ parameters. Differences in pre–post intervention change of trend between intervention and control areas were explored by calculating the interaction between ‘trend’, ‘period’, and ‘district’. All analyses were adjusted for age (continuous), sex, household composition (four categories), ethnicity (Dutch, western non-Dutch, non-western ethnic background and unknown), education (five ordinal groups), and standardised disposable household income (quintiles) at the individual level. Additionally, we adjusted for the overall intensity of the District Approach, based on the number of interventions across all 18 different types of activities (for detailed description, see Droomers et al),23 in an attempt to adjust for the impact of the other interventions that were carried out within the context of the District Approach. The intensity of the District Approach, however, did not change our findings; results of these analyses are, therefore, not reported. Data were analysed using R (V.2.11.1).
Results
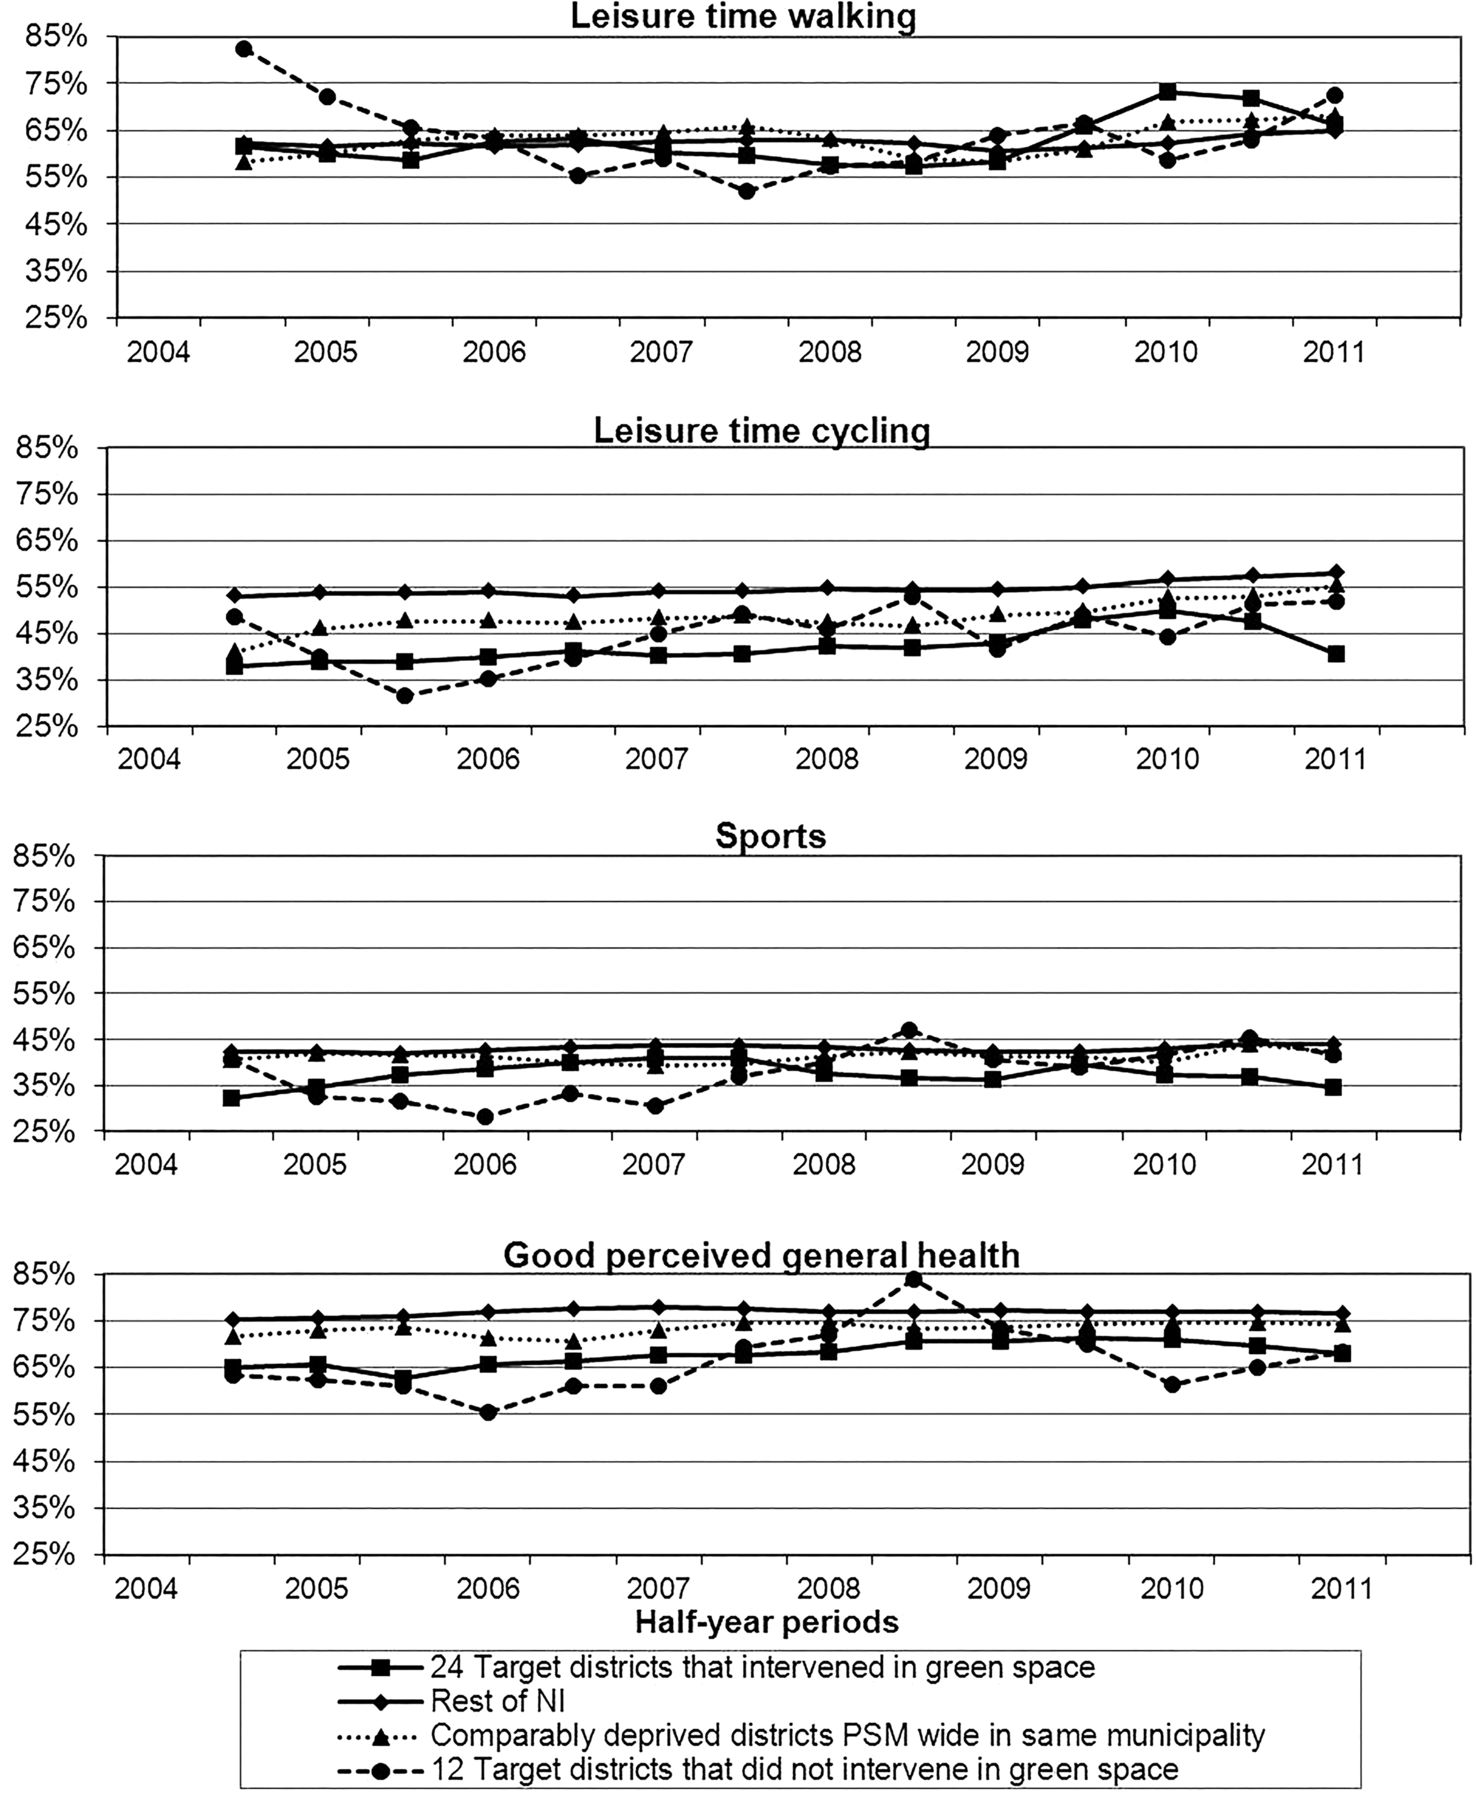
The prevalence of leisure walking at least once a week seemed to increase after 2008 in all groups (figure 1). This positive trend change is most obvious among the 12 deprived neighbourhoods that did not intervene in their green space. These neighbourhoods even showed a significantly more positive change in walking prevalence than the 24 deprived neighbourhoods that did intervene in green. The trend change in the prevalence of walking in those neighbourhoods that invested in green did not differ from the trend change in walking prevalence in any of the other three groups of control areas (table 1).
Comparison of development in prevalence of leisure time walking, cycling and sports, and good general health between 2004–2008 and 2008–2011 in 24 deprived neighbourhoods that intervened in green space and four different selections of control areas

Trends in prevalence of leisure time walking, cycling and sports, and perceived general health between 2004 and 2011 in (1) 24 deprived intervention neighbourhoods that intervened in green space, (2) 12 deprived neighbourhoods, (3) deprived control areas (wide definition, same municipality) and (4) the rest of Netherlands. The prevalence for each half year is the average prevalence of that specific half year and the half year before and after (moving average).
The prevalence of leisure cycling at least once a week was highest among those living in other parts of the Netherlands and lowest in the 24 deprived neighbourhoods that intervened in green space (figure 1). In the deprived neighbourhoods that intervened in green space, the prevalence of cycling statistically significantly increased between 2004 and 2008, and continued to do so after the start of the interventions, though this increase was offset by the decline that followed mid-2010 (figure 1; table 1). Conversely, the prevalence of leisure cycling in the rest of the Netherlands started to increase after 2008 (table 1). Despite these apparently diverging patterns, there was no statistically significant difference in the development of cycling prevalence between the intervention neighbourhoods and any of the selected control areas (table 1).
The prevalence of playing sports was lowest among those living in neighbourhoods that invested in green and highest in other parts of the Netherlands (figure 1). None of the neighbourhoods showed a change in the prevalence of playing sports during 2004 and 2011 (table 1). There were, therefore, no significant differences in the changes in trend before and after 2008 between the deprived neighbourhoods that intervened in green and the control areas (table 1).
The prevalence of good perceived general health was higher among the rest of the Netherlands than in deprived control areas, and lowest among deprived neighbourhoods that invested in green space (figure 1). All groups of neighbourhoods showed an increase in the prevalence of good perceived general health until 2008 and a deterioration of general health afterwards, though most not statistically significant, except in the other parts of the Netherlands (table 1). There was no significant difference between the change in trend of good health between the neighbourhoods that intervened in their green space and any of the control areas (table 1).
Similar results were observed when we evaluated only those 18 deprived neighbourhoods that increased the amount or quality of the usable green space (table 2).
Comparison of development in prevalence of leisure time walking, cycling and sports, and good general health between 2004–2008 and 2008–2011 between 18 deprived neighbourhoods that intervened in green space to be used by residents and four different selections of control areas
Discussion
The trend change in the prevalence of being physically active at least once a week, as well as good perceived general health, did not differ between the deprived neighbourhoods that changed the quality or quantity of their green space and the control areas. We did not observe short-term positive effects on physical activity and general health among adults from improvements in green space in deprived neighbourhoods.
Strengths and limitations
This is one of the few studies that investigates the public health impact of actual changes in green space. We employed a quasi-experimental design comparing intervention neighbourhoods with different groups of control areas, and used repeated cross-sectional data that allowed for follow-up over a prolonged period of time.
Owing to the use of cross-sectional data, selective non-response or migration might have influenced our results. We have, however, no reason to expect the non-response or migration to have differed over time and hence, to have affected our trend estimates. Furthermore, we have adjusted our analyses for differences between the samples regarding several sociodemographic characteristics of the respondents.
We report the short-term impact of changes in green space, that is, within 3½ years after the start of the District Approach. We may, therefore, have underestimated those effects that still need more time to develop, especially when such impact is achieved indirectly through improvements in social cohesion or safety.
We used data on physical activity, irrespective of the site of the activity. This might have caused us to underestimate the impact of changes in green space within the neighbourhood, that are thought to have their biggest impact on physical activity directly within the vicinity of the home, such as walking to neighbourhood shops, and to a lesser extent on activities that are carried out outside the neighbourhood, for example, at a sports club located at the other side of the town.30
The green interventions in the deprived neighbourhoods have been tailored to meet local needs. This resulted in a great variety of different interventions and actual changes in green space. The natural experiment evaluated here does not allow for studying the health impact of specific individual green interventions. Our results have to be interpreted bearing in mind that we report on the public health impact of a varied mix of locally tailored green interventions.
We have evaluated real-life green interventions that were carried out simultaneously with many other interventions targeting the problems of employment, housing, education, social cohesion or safety. This most likely reflects the reality in which most green interventions take place, that is, within the context of many other neighbourhood, municipal or even national interventions intended to improve multiple aspects of the living situation. It is possible that the health impact of the improvements in green space may have been outweighed by the impact of other interventions that discouraged physical activity and led to a detrimental health impact. Information on the amount, duration and scale of 17 other types of interventions that were part of the District Approach was summarised in one measure that reflected the intensity of the District Approach.23 Adjustment of the results presented here for this summary measure did not alter any of the results (results not shown). We recommend future evaluations of green or other specific types of interventions to take into consideration more detailed reports on changes in other living circumstances that affect physical activity or health in order to distinguish between different pathways by which health outcomes are affected. Our study, reported in this paper, showed that the evaluation of specific types of interventions within the context of complex area interventions only yields evidence with limited generalisability.
Explaining the lack of public health impact of changes in green space
We found no short-term impact on physical activity or general health of these large-scale improvements in green space in deprived neighbourhoods. This is contradicted by some earlier evaluations of greening of living areas that reported increased physical activity,19 ,20 as well as less reported stress19 and better mental health.21 The lack of a health impact of improvements in green space reported here is, however, in line with earlier Dutch studies that suggested that green space does not directly affect total physical activity7 ,31 and at times also failed to show an association with health.10 It has been suggested that in the Netherlands, greening of the environment is just the adding of extra green space to the already present green space and hence, is one of providing a new location for existing physical activity patterns instead of leading to an increase in the number of people who are physically active.3 We were unable to follow-up on this because we did not have information on the amount of green available at the start. Furthermore, the beneficial effect of green space in the Netherlands might more likely operate through a positive impact on stress levels and social cohesion;7 ,10 ,32 therefore, the health impact might not have yet become visible during our short-term evaluation.
We have illustrated that the green interventions that were part of the District Approach did result in large-scale changes in green (box 1). It might, however, be argued that for a visible public health impact, the green interventions and changes will have to be even more substantial. Other studies have, for example, suggested that larger green spaces are more important for protecting and improving health.4 ,10
Safety issues are often mentioned as a barrier to the use of green space and therefore, for the occurrence of potential health benefits.2 ,33 We have concluded in another study that the District Approach has not had the expected positive impact on safety in these deprived neighbourhoods (D Kramer, B Jongeneel-Grimen, K Stronks, et al. Are area-based initiatives able to improve area safety in deprived areas? A quasi-experimental evaluation of the Dutch District Approach, submitted for publication). The continuing safety problems might be the reason for a lack of impact of the improvement in the availability and quality of green spaces in these neighbourhoods. Also, like in Philadelphia, USA,19 the greening of vacant urban spaces in itself might have led to increased safety problems, such as more disorderly conduct and illegal dumping. Such increases in unsafety caused by greening might in itself counterbalance any concurrent positive health impacts.
Conclusion
Intervening in the quantity or quality of green space as part of the Dutch District Approach did not yield positive short-term results, in terms of an increase in the prevalence of physical activity or good self-reported health. This suggests that greening interventions as carried out in the context of the Dutch District Approach did not achieve short-term health gains among adults.
What is already known on this subject
Many problems concentrate in deprived neighbourhoods, among which is poor health. One possible way to address these health problems is to invest in the green space in deprived neighbourhoods. The limited number of evaluations of the public health impact of actual changes in neighbourhood green space has produced mixed results. It is, hence, uncertain whether improvements in green space have the potential to increase physical activity or improve health.
What this study adds
We compared the deprived neighbourhoods that changed the quality or quantity of their green space with different groups of control neighbourhoods. We observed that changes in the trend of physical activity as well as good perceived general health were not more favourable in the deprived neighbourhoods than in the control neighbourhoods. We conclude that intervening in the quantity or quality of green space, as part of the Dutch District Approach, had no demonstrable positive short-term impact on the prevalence of physical activity or self-reported health among adults living in deprived neighbourhoods.
References
Supplementary materials
Supplementary Data
This web only file has been produced by the BMJ Publishing Group from an electronic file supplied by the author(s) and has not been edited for content.
- Data supplement 1 - Online supplement
Footnotes
Contributors MD has designed the research questions and plan of analyses. MD interpreted the results and was the main author of the manuscript. BJ-G has developed the statistical procedures followed, performed the statistical analyses, and has contributed to the interpretation of the work and several versions of the manuscript. DK has developed the statistical procedures followed, and has contributed to the interpretation of the work and several versions of the manuscript. SdV has contributed to the research plan, and the interpretation of the work and several versions of the manuscript. J-WB has put in his expert knowledge of the data used, and contributed to the interpretation of the work and several versions of the manuscript. SK, HvO, AEK and KS have all been contributors to the acquisition for and development of the URBAN40 study, and to the interpretation of the work and several versions of this manuscript.
Funding This paper is part of the URBAN40 study, which is financed by the Netherlands Organisation for Health Research and Development (ZonMw) and the Dutch Ministry of the Interior and Kingdom Relations. The evaluation of the effect of intervening in green space in the context of the Dutch District Approach, reported in this paper, was financed by the Dutch Ministry of Economic Affairs.
Competing interests None declared.
Provenance and peer review Not commissioned; externally peer reviewed.
Data sharing statement The manuscript was based on already available data sources from third parties that have been analysed to answer our research question.