Article Text

Abstract
Background Sleep plays an important role in health and varies by social determinants. Little is known, however, about geographic variations in sleep and the role of individual-level and neighbourhood-level factors.
Methods We used a multilevel modelling approach to quantify neighbourhood variation in self-reported sleep duration (very short <5 h; short 5–6.9 h; normative 7–8.9 h; long ≥9 h) among 3591 participants of the Boston Area Community Health Survey. We determined whether geographic variations persisted with control for individual-level demographic, socioeconomic status (SES) and lifestyle factors. We then determined the role of neighbourhood SES (nSES) in geographic variations. Additional models considered individual health factors.
Results Between neighbourhood differences accounted for a substantial portion of total variability in sleep duration. Neighbourhood variation persisted with control for demographics, SES and lifestyle factors. These characteristics accounted for a portion (6–20%) of between-neighbourhood variance in very short, short and long sleep, while nSES accounted for the majority of the remaining between-neighbourhood variances. Low and medium nSES were associated with very short and short sleep (eg, very short sleep OR=2.08; 95% CI 1.38 to 3.14 for low vs high nSES), but not long sleep. Further inclusion of health factors did not appreciably increase the amount of between-neighbourhood variance explained nor did it alter associations.
Conclusions Sleep duration varied by neighbourhood in a diverse urban setting in the northeastern USA. Individual-level demographics, SES and lifestyle factors explained some geographic variability, while nSES explained a substantial amount. Mechanisms associated with nSES should be examined in future studies to help understand and reduce geographic variations in sleep.
- GEOGRAPHY
- Neighborhood/place
- EPIDEMIOLOGY
- SOCIO-ECONOMIC
Statistics from Altmetric.com
Introduction
Sleep, and in particular sleep duration, is an increasingly recognised determinant for a wide range of physical and mental health outcomes.1–5 While long and short sleep duration have been associated with adverse health outcomes,6–9 including cardiovascular disease (CVD), diabetes, obesity and mortality, short sleep duration in particular may have a deleterious impact on health, appearing to deregulate physiological processes relating to appetite10 ,11 and glucose metabolism,12 and has also been associated with shorter telomere length.13 Not all segments of the population, however, appear to have equal distributions of sleep duration. Disparities have been noted by race/ethnicity14 ,15 and socioeconomic status (SES),16 ,17 with shorter sleep duration in those with low SES and in minority populations.18 Sleep symptoms such as sleep latency, sleep disturbances and sleep quality also differ by social and demographic factors.19 Such disparities have been proposed to mediate racial and socioeconomic disparities in health.14 ,15 For example, African-Americans and Hispanics have shorter sleep durations as compared to Caucasians, rates of obesity and diabetes are higher among these racial/ethnic groups, and the prevalence of coronary heart diseases is greater in black populations than in any other racial/ethnic group.20–22 Other individual determinants of sleep have also been documented, including lifestyle habits such as smoking and alcohol consumption.23 ,24
While individual determinants of sleep have been previously studied, little is known about how these factors may contribute to geographic differences in sleep, and further, how contextual factors may contribute to geographic variations in sleep. Specifically, individuals with similar characteristics (eg, demographics) living in a common environment may give rise to geographic differences in sleep. At the same time, those with different characteristics living in a common environment may experience similar sleep patterns because of geographic contextual influences (eg, neighbourhood determinants) relating to the physical environment, economics, culture, etc. These neighbourhood determinants can lead to geographic differences in sleep.
Indeed, living in an urban environment and dense population areas has been previously linked with sleep duration, supporting the notion that sleep varies by geography.14 Some data from studies of the elderly have also suggested urban/rural differences in reported sleep complaints.25 However, to date, only one study has formally investigated geographic differences in sleep while controlling for individual-level factors,26 finding an independent effect of ‘place’ on sleep. Other studies have reported associations between perceived low neighbourhood quality and poor sleep,27–29 neighbourhood unemployment and insomnia,30 as well as neighbourhood/residential SES and adherence to continuous positive airway pressure therapy for obstructive sleep apnoea,31 ,32 suggesting that factors at the neighbourhood level may contribute to neighbourhood-level variations in sleep. To the best of our knowledge, neighbourhood-level variations in sleep within a single geographic area have not been assessed. Studying a single geographic area minimises confounding by factors that may vary by geography (eg, cultural differences, climate, natural photoperiods).
The objectives of this study were to use a multilevel modelling approach to determine whether sleep duration varies by neighbourhood in a large diverse urban setting, and to characterise contributions of individual-level and neighbourhood-level determinants to geographic variations. We assessed whether any observed geographic variations in sleep were independent of individual-level demographics, SES and lifestyle factors and, further, neighbourhood SES (nSES). We investigated neighbourhood socioeconomics as a composite measure reflecting correlated measures of neighbourhood wealth/income, education and income,33 which has been used similarly in epidemiological studies to assess relationships between neighbourhood and health.34 The main sleep parameter of interest was self-reported sleep duration, which is commonly measured in epidemiological studies of sleep duration and health outcomes.16 As sleep is increasingly understood to be a determinant of health outcomes, understanding geographic disparities in sleep and the role of nSES may help explain disparities in downstream health outcomes. Further, identifying the role of neighbourhood in sleep may help to identify targeted interventions for improvements in sleep within communities and, as a result, improvements in related health consequences.
Methods
Study population and setting
The study population consisted of a subset of participants of the Boston Area Community Health Survey (BACH), a longitudinal survey of a random sample of 5502 residents (2301 men, 3201 women) aged 30–79 years from three racial/ethnic groups (African-American, Hispanic and Caucasian) in Boston, Massachusetts, USA. BACH was initiated in 2002 and conducted in participants’ homes approximately every 5 years for a total of three surveys to date. The current analysis uses cross-sectional data from the second survey conducted between 2006 and 2010. A total of 4144 men and women participated in BACH II. Only participants who had complete data on sleep duration (92.3%), a geocodable address (99.2%) and who resided in the Boston area at the second follow-up (87.6%) were included in the analysis, leaving 3591 participants. At each home visit, participants completed an in-person interview, including questions on demographics, sleep outcomes, comorbidities and lifestyle factors. Further details on the BACH cohort and study methods have been previously published.35 ,36 All participants provided written informed consent. The study was approved by the Institutional Review Board of the New England Research Institutes, Inc.
Geocoding
Participants’ residential addresses were geocoded using ArcGIS (ESRI 2011. ArcGIS Desktop: Release 10. Redlands, California, USA: Environmental Systems Research Institute). Geocoded addresses were used to link participants with their respective neighbourhood-level data. Neighbourhood boundaries were defined in accordance with the Boston Redevelopment Authority.37 The cities of Chelsea and Revere, which are part of the same county as Boston (Suffolk County) were included as separate neighbourhoods.
Neighbourhood SES
To characterise nSES, we utilised a composite score based on neighbourhood measures of median value of owner-occupied housing; per cent of households receiving interest, dividend or net rental income; per cent of adults 25 years and over with high school degree; per cent of adults 25 years and over with a college degree; and per cent of individuals aged 16 years and over in management and professional occupations.33 These measures were based on 2010 census tract data and were obtained by taking population-weighted averages of the census tracts located within the neighbourhood. A composite index Z-score was created from the neighbourhood measures to reflect overall nSES, with an increasing Z-score signifying better neighbourhood socioeconomic advantage. Neighbourhoods were designated as low, medium or high SES according to the tertiles of the Z-score.38
Individual-level variables
The impact of individual-level demographic, socioeconomic and lifestyle variables on neighbourhood variation in sleep duration was evaluated and these variables were treated as potential confounders of the association between nSES and sleep duration. Demographic measures included self-reported race/ethnicity (African-American/Hispanic/Caucasian), age, gender and marital status. SES was characterised by a categorical variable (low/medium/high) based on the methods of Green.39 We also considered lifestyle factors of alcohol use (none/low/medium/high), smoking (current/former/never) and physical activity (low/medium/high) as determined by the Physical Activity Scale for the Elderly.40
In additional subanalysis, we considered the impact of health-related variables, as these may confound the relationship between nSES and sleep duration, but may also mediate the relationship, or occur as a consequence of sleep duration. These health-related variables included self-perceived stress as determined with the 4-item Perceived Stress Scale,41 depression measured with the abridged Center for Epidemiologic Studies Depression Scale,42 self-rated health measured by the 12-item Short Form Health Survey43 and obesity (body mass index (BMI) ≥30 kg/m2). We also considered self-reported physician-diagnosed diabetes, hypertension and CVD. Sleep medications (eg, Ambien, Lunesta), including medications within the sedative hypnotic class that are used to induce sleep (benzodiazepines and related hypnotics (zolpidem, zaleplon and eszopiclone), antihistamines used for sleep (diphenhydramine and doxylamine) and melatonin), used in the past 4 weeks, were captured using both self-report and direct recording of medication labels by the interviewer and coded using the Slone Drug Dictionary.44
Sleep duration
Participants were asked about their usual sleep duration in the previous month, with the question, “How much do you usually sleep?” collected in hours to the tenths place. Forty individuals who reported ≤2 h were excluded from analysis as these were considered extreme outliers/invalid responses. Because of the U-shaped relationship between sleep duration and adverse health outcomes,6–9 we categorised sleep duration as very short (<5 h), short (5–6.9 h), normative (7–8.9 h) and long (≥9 h).
Statistical analysis
Sleep duration was modelled as a multinomial categorical variable. Owing to the hierarchical structure of the data with individuals nested within neighbourhoods, we used multilevel multinomial models with random intercepts to account for clustering of sleep duration by neighbourhood. Multilevel models were constructed in steps of increasing complexity. In the first step, an intercept-only multilevel model (ie, null model) was constructed to quantify the within-neighbourhood ( ) and between-neighbourhood variance (
 ) of the outcome and to test for significant variation in sleep duration by neighbourhood. The intraclass correlation coefficient (ICC) was computed to quantify the amount of variability in sleep duration attributable to the neighbourhood level relative to total variability (
 ). We assumed an underlying standard logistic distribution for each of the sleep duration categories at the individual level (
 ) with the standard logistic variance of π2/3. Next, multilevel random intercepts models were constructed with individual-level predictors modelled as fixed effects. We first included demographic variables and then added socioeconomic variables. In the final step, nSES was added to the random intercepts model that included the individual-level variables. At each step, the proportion of remaining
  in sleep duration, which was explained by the model, was calculated to determine whether neighbourhood variation persisted after accounting for individual-level factors (ie, neighbourhood compositional factors) and, finally, how much variation could be attributed to nSES itself. In subanalyses, we constructed models with the addition of individual-level health-related variables.
To account for the BACH survey design, observations were weighted inversely to their probability of selection at baseline to produce unbiased estimates of the Boston population. Survey weights were adjusted for non-response bias at follow-up using the propensity cell adjustment approach,45 and post-stratified to the Boston census population in 2010. To preserve the maximum available sample size, multiple imputation was used to impute missing values by gender and race/ethnicity. A total of 15 multiple imputations were performed in IVEware.46 Descriptive statistics were conducted in SAS callable SUDAAN V.11 (RTI, Research Triangle Park, North Carolina, USA). Mplus V.7 (Muthen & Muthen 1998–2012) was used to conduct the multilevel analyses.
Results
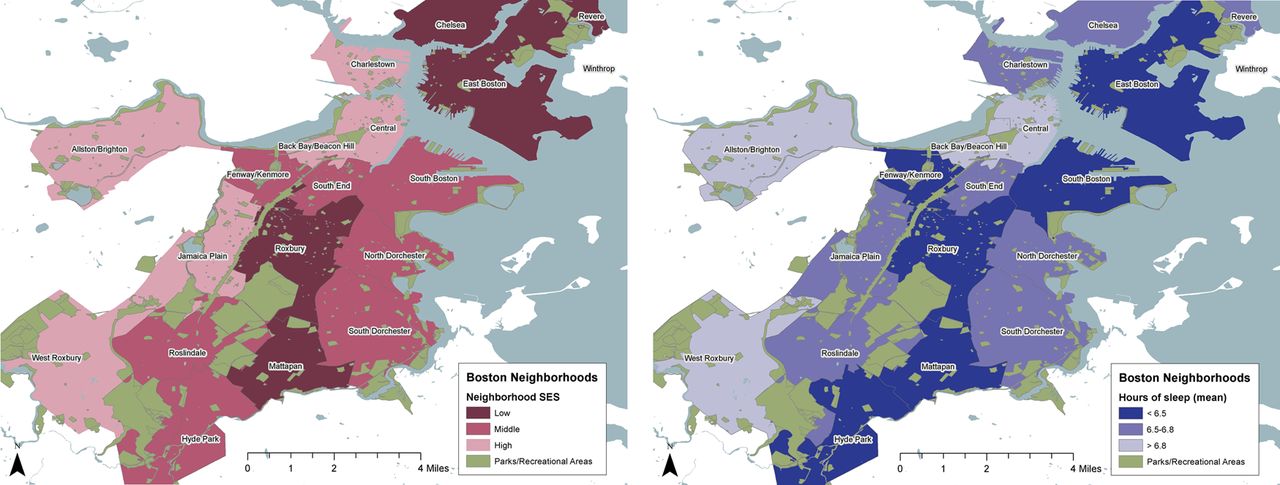
The study population consisted of a racially/ethnically balanced mix of 3591 individuals (33.1% African-American, 34.1% Hispanic and 32.7% Caucasian). Weighted to the Boston population, the cohort was 57.1% Caucasian, 54.7% women, 44.3% medium SES and 53 years of age on average (table 1). Forty-six per cent resided in a neighbourhood with medium SES. African-Americans were less likely to live in a neighbourhood with high SES (10.8%) whereas 47.5% of Caucasians lived in a neighbourhood with high SES. Individual-level SES tracked somewhat with nSES, with 33.1% of those with low SES living in a low-SES neighbourhood, 47.4% of those with medium SES living in a medium-SES neighbourhood and 49.6% with high SES living in a high-SES neighbourhood. Sleep duration averaged 6.6 h across the study population and differed by nSES, with sleep duration shortest in low SES neighbourhoods (p<0.0001; figure 1). When categorised, close to half the weighted study population reported normative sleep (47.3%), while 36.7% reported short, 9.1% very short and 6.9% reported long sleep. Those in low nSES had the greatest proportion of very short sleep (15.5%).
Characteristics of study population distributed by neighbourhood SES (n=3591)

Neighbourhood socioeconomic status (SES) and distribution of sleep duration by Boston neighbourhood 105×41 mm.
Neighbourhood variation in sleep duration and determinants
A null intercept-only model yielded significant between-neighbourhood variance estimates of 0.980, 0.241 and 1.332 for very short, short and long sleep, respectively, providing further evidence of geographic variation in sleep duration (table 2). The ICC indicated that 23%, 6.8% and 28.8% of the total variability in very short, short and long sleep duration, respectively, was attributable to between-neighbourhood differences, while the remainder was attributable to individual-level factors and unmeasured confounders.
Model estimated between-neighbourhood variance from null and adjusted multilevel multinomial models of sleep duration*
With the addition of individual-level demographic variables to the model,  persisted but was reduced by 5.6% among long sleepers and 19.9% among very short sleepers
  (table 2). In other words, clustering of demographic characteristics by neighbourhood explained a portion of the between-neighbourhood variability in sleep duration. With further addition of individual-level SES and lifestyle factors, an additional 5.1–9.3% of
  remaining from the demographics-adjusted model was explained for very short, short and long sleep durations. With addition of nSES to the model, 88.6% of the remaining very short sleep
  was explained, while 98.9% of the remaining long sleep
  was explained. Looking at the ICC, the total variance attributable to between-neighbourhood factors was reduced to 20.6% for very short sleep and 26.2% for long sleep. Inclusion of health-related variables in the multilevel multinomial model explained little of the remaining
  for very short and short sleep, but a substantial portion of the remaining, albeit small amount of
  for long sleep (33.3% of remaining 1.3%).
Association between nSES and sleep duration
nSES was significantly associated with very short as well as short sleep in univariate and multivariable models, with greatest risks in those with low nSES as compared to high nSES, though medium nSES was also associated with very short and short sleep (table 3). In particular, low nSES was associated with odds of very short sleep that was 2.08 times greater than high nSES (95% CI 1.38 to 3.14). Associations between nSES and long sleep were not observed. When we included health-related variables in the multilevel multinomial model, effect estimates for nSES were not appreciably altered.
Association between neighbourhood SES and sleep duration from multilevel multinomial models*
Discussion
This study investigated geographic variation in sleep duration at the neighbourhood level in a diverse urban setting in the northeastern USA, and specifically the contributions of individual-level variables and nSES on geographic variation. We found evidence of neighbourhood variability in sleep duration, with shorter sleep duration in neighbourhoods with lower SES. ICCs of greater than 10% are considered to be of medium magnitude,47 and thus the amount of variability in sleep duration, particularly for very short (23%) and long sleep (28.8%), attributable to between-neighbourhood differences, was large. In a recent study, between-neighbourhood variance accounted for 5.5% of the total variance in BMI in a northern California cohort.48 Individual-level demographics, SES and lifestyle factors, which are known predictors of sleep duration, accounted for a portion (10–29%) of the between-neighbourhood variation in sleep duration, indicating that clustering of these factors within neighbourhood explained a portion of the geographic variation in sleep duration. Neighbourhood variation in sleep duration persisted, however, with control for the individual-level factors. The remaining between-neighbourhood variation in sleep duration was explained almost entirely by nSES, suggesting that the neighbourhood socioeconomic context itself, as measured by our composite nSES measure, has an influential role on sleep duration. Further control for health-related factors explained a negligible proportion of the between-neighbourhood variability in sleep duration.
To the best of our knowledge, only one study to date has formally investigated geographic variations in sleep,26 and none have examined these differences at the neighbourhood level or used a multilevel modelling approach to identify factors that account for geographic variation. Using data from the 2006 BRFSS, Grandner et al26 identified significant geographic variability in sleep disturbance and daytime fatigue across 36 states even after controlling for individual demographics, socioeconomics, health and lifestyle factors, and regional differences in sunlight and weather patterns. Although our sleep measure differed, our finding of geographic variations in sleep duration at the neighbourhood level, which persisted after control for individual characteristics, is consistent with these findings.
Additional studies also suggest a role of geography on sleep. For example, national data from National Health Interview Survey (NHIS) and the Census revealed that living in urban and more populated environments was associated with increased odds of short sleep.14 Further evidence of geographic variation in sleep duration also comes from a study of eight European countries examining geographic variation in the association between sleep duration and overweight, finding that sleep duration differed significantly between countries.49 From the broader context of environmental effects on sleep, geographic differences also can be resolved into seasonal effects involving climate or natural photoperiods, artificial light utilisation, and/or more diversely defined sociocultural effects involving societal features such as nutritional well-being and combat exposures. Any or all of these factors might be expected to influence how much sleep is reported by populations at any given point in time.50
A small number of studies have also linked neighbourhood characteristics at the individual level with individual sleep measures, consistent with our finding that nSES is associated with sleep duration. Perhaps most comparable to ours is a study from Germany, which found neighbourhood unemployment, a characteristic related to nSES, was associated with insomnia, particularly in those with low income and who were socially isolated.30 While that study investigated effects of neighbourhood-level variables, clustering by neighbourhood was not accounted for because the neighbourhood variables were assigned at the individual level taking into account months of exposure at the home address, and residential history. In addition, perception of neighbourhood quality on sleep quality has been studied in population-based samples of Southwestern and Midwestern adults in the USA. These studies showed that living in a neighbourhood that was perceived as noisy, unclean and crime-ridden was associated with poorer sleep quality.27–29 The authors hypothesised that perceptions of neighbourhood disorder undermine sleep as a resource that would otherwise buffer against adverse psychological impacts of neighbourhood disorder, finding that poor sleep quality partially mediated and moderated effects of neighbourhood disorder on psychological stress.28 ,29 Poor sleep quality also mediated effects of neighbourhood disorder on and self-rated health.27 ,28
The mechanism(s) by which nSES may impact sleep duration are unclear but likely involve the direct action of physical and environmental hazards; the indirect effects of psychological and physiological pathways; and/or the indirect effects of health behavioural mechanisms.28 For example, elevated levels of ambient air pollution or environmental noise associated with living in poorer disadvantaged areas may directly lead to physiological responses (eg, increased heart rate from noise and/or air pollution exposures) that in turn impact sleep duration. It is also conceivable that stress related to fear when living in poorer neighbourhoods with increased violence can impact sleep duration. Those residing in lower SES neighbourhoods are also likely to have poorer lifestyle habits and health, including increased diabetes and respiratory problems, and other chronic health conditions that can shorten sleep duration. These relationships, in particular health conditions, with neighbourhood and sleep are likely complex, and our choice to model these separately reflected the fact that some conditions may occur downstream of sleep, may mediate the association between neighbourhood and sleep, or may be a ‘common cause’ of both residence and sleep.
In the absence of direct measures of neighbourhood characteristics, we used a composite measure of neighbourhood socioeconomic position that allowed us to look at one measure likely reflecting several neighbourhood constructs. Additional research in this area should investigate other neighbourhood characteristics, including direct measurements of the built environment, noise, pollution and crime levels. This study also had other potential limitations, including the use of self-reported sleep duration, which is subject to measurement error. Any such error in the outcome, however, would not bias effect estimates, but could decrease power. While we would ideally assess objective measures of sleep, such measurements were not available in our study. Self-reported sleep duration, however, is widely used in epidemiological studies and has been linked with adverse health. Further, mean duration in our study population was comparable to others, supporting the validity of our findings.15 ,51 Notably, we excluded observations with <2 h of sleep. While not significantly different by nSES, a slightly greater proportion of those with <2 h sleep lived in neighbourhoods with low SES (47.5% vs 35.4%), and thus our effect estimates may be underestimated. Future studies of geographic variations in sleep should consider objective sleep measures and additional subjective measures such as self-perceived sleep quality. It should also be noted nSES may impact sleep duration differently in non-urban settings and in different parts of the country and, therefore, our results may not be generalisable to non-urban neighbourhoods and areas outside of the northeast USA. Despite these limitations, this study is the first to investigate neighbourhood variability in sleep duration in a diverse urban setting, and was strengthened by a large, well-characterised cohort and the use of a multilevel modelling approach that accounted for clustering of the data and partitioned out variability at the individual and neighbourhood level.
Conclusions
In summary, sleep duration varied at the neighbourhood level in a diverse urban setting in the northeastern USA, with shorter sleep duration in neighbourhoods with lower SES. Given known associations between short sleep duration and adverse health, our findings further support the hypothesis that sleep disparities mediate disparities in health. As both a determinant of neighbourhood variability in sleep duration and a significant predictor of sleep duration in this study, further attention should be given to the role of nSES and its correlates on sleep. Other neighbourhood characteristics should also be examined in future studies to help explain geographic variations in sleep outcomes and to identify novel means of improving sleep.
What is already known on this subject
-
Sleep duration is a predictor of a wide range of health outcomes and varies by social determinants. Little is known, however, about geographic variations in sleep duration, especially at the neighbourhood level, and the role of individual-level and neighbourhood-level factors on geographic variations.
What this study adds
-
Sleep duration varies by neighbourhood in an urban northeastern USA setting, with shorter sleep duration in neighbourhoods with lower socioeconomic status (SES). Geographic variability persists after accounting for individual-level demographics, SES and lifestyle factors. Neighbourhood SES accounts for a large portion of this variability and is strongly associated with sleep duration above and beyond individual-level factors.
References
Footnotes
-
Contributors ABA, HKY, SVS, DLB and RP conceived of the study question. SCF, RP, MY and ABA developed the study design and analysis plan with input from DLB, SVS and HKY. SCF and MY analysed the data. SCF drafted the article and all authors reviewed and provided input to the article, contributed to interpretation of data and approved the version submitted for publication.
-
Funding Funding for this research was provided by the National Institute on Minority Health and Health Disparities R21MD006769 the National Institute of Diabetes and Digestive and Kidney Diseases U01DK056842.
-
Competing interests None.
-
Ethics approval The study was approved by the Institutional Review Board of the New England Research Institutes, Inc.
-
Provenance and peer review Not commissioned; externally peer reviewed.
Linked Articles
- Corrections