Article Text

Abstract
Objectives In the first decade of the 21st century, the Mexican life expectancy changed from a long trend of increase to stagnation. These changes concur with an increase in deaths by homicides that the country experienced in that decade, and an obesity epidemic that had developed over the last decades of the 20th century. We quantify the impact of causes of death on life expectancy from 2000 to 2010.
Methods Two approaches to analyse causes of death are used: the number of life years lost due to each of the causes of death in a given year, and cause-decomposition techniques for comparisons of life expectancy from 2000 to 2010.
Results The apparent stagnation in life expectancy is the result of an increase in deaths by homicides and diabetes mellitus on the one hand, and the positive improvements observed in other causes of death on the other. The negative impact of homicides is particularly observed for ages 15 and 50, and for that of diabetes mellitus at ages above 45 years.
Conclusions There is little basis for optimism regarding the future scenarios of the health of the Mexican population based on the first decade of the 21st century. Male life expectancy would have increased by 2 years if deaths by homicides and diabetes mellitus had been avoided.
- DEMOGRAPHY
- HOMICIDE
- DIABETES
- DEVELOPING COUNTR
- INTERNATIONAL HLTH
Statistics from Altmetric.com
Introduction
Life expectancy in 1950 in Mexico was 51 years for women and 47 years for men,1 but by 2000, these numbers had changed to 77 years for women and 72 years for men.2 These changes correspond to annual increases in life expectancy of 0.38 and 0.40/year for women and men, respectively. These rates of increase are far higher than the long uninterrupted increase of 0.25/year observed in the trend of the female maximum life expectancies in the world.3 Thus, the longevity gap between Mexico and the developed countries that hold the highest life expectancy in the world has been greatly reduced.
In the first decade of the 21st century, Mexico experienced a dramatic change in its public health: from 2000 to 2010, life expectancy for men stagnated, whereas women experienced a modest increase in life expectancy of half a year during the entire decade. These changes concur with an increase in deaths by homicides4 and deaths due to diabetes mellitus.5 Particularly for deaths by homicides, the increase in the 2000s was a dramatic shift in the downward tendency observed in the previous years.4 The obesity epidemic that was unprecedented in the country6 and sedentary life becoming more common5 can be mentioned as some of the factors that have triggered the increase in diabetes mellitus. The focus of the present study is to assess the contribution of external causes of deaths, particularly homicides, and diabetes mellitus in order to explain the observed stagnation in life expectancy. We examine the possible role of other causes of death in this stagnation and quantify the changes in the age-pattern of mortality.
Data
This project uses two types of data: death counts by causes of death and complete life tables for the period 2000–2010. The information on deaths by cause of death is obtained from the National Institute of Statistics and Geography,7 and we use the sex-specific life tables elaborated by the Mexican Demographic Society, SOMEDE2 for each year between 2000 and 2010.
The causes of death during the period studied are classified using the WHO's International Classification of Diseases tenth revision (ICD-10). Information on death counts is available for sex and single age for each calendar year from 2000 to 2010. Death counts were grouped into 5-year age groups and an open age group of 85 years and more, and 10 broad causes of death: infectious diseases, neoplasm, diseases of the circulatory system (cardiovascular disease, CVD), mental disorders, endocrine/nutritional and metabolic disorders (with diabetes mellitus as the main cause of death of the group), diseases of the digestive system, certain conditions originating in the perinatal period, homicides, other external causes (including accidents and suicide), and a group of “remaining causes” not accounted for in the previous nine cause groupings. Details of the ICD-10 used are found in table 1.
Life years lost up to selected ages and causes of death for Mexican females and males in 2000 and 2010 and the difference between these years
The life tables from SOMEDE2 use deaths and population counts that are corrected for age mis-specification and misreporting. After the death and population counts are smoothed, the age-specific death rates are calculated.2 Subsequently, life tables are calculated according to the methodology proposed by Preston et al.8 The life table data for each calendar year was aggregated into 5-year age groups and an open age group of 85 years and more, to match the grouping of the cause of death information.
Methods
Ethics statement
Since this manuscript involved secondary data analysis of public sources, which did not have any individual identifiers, ethics approval from our respective institutions, Institutional Review Board (IRB), were not required.
Statistical methods
Two different approaches to analyse causes of death are used here: a description of the number of life years lost due to each of the causes of death in a given year, and a more traditional decomposition technique for comparisons of life expectancy at birth. The two methods complement each other by showing: a snapshot of the current mortality in a population, or life years lost; and the changes due to age and causes of death in two life tables, or decomposition of life expectancy. The two methods are briefly explained below (both analyses were carried out using the R software http://www.r-project.org/).
The proportion of deaths at age x by cause i in respect of all deaths, denoted as c(x,i), was calculated and applied to the age-specific death rates at age x, m(x), to obtain age-specific and cause-specific death rates: m(x,i)=c(x,i)•m(x). These age-specific and cause-specific death rates were used both in the calculation of years lost and in the decomposition analysis explained below. We work with the broadly defined causes of death to calculate the life years lost in 2000 and 2010 and the changes when comparing these 2 years.
We calculate the years lost due to different causes of death by focusing on the cumulative death distribution. We let the life table function of the distribution of deaths from 0 to the given age x,  , be further subdivided into deaths by the different causes of death,
  . If there are n mutually exclusive causes of death, the number of years lost to each cause of death between ages 0 and a can be calculated as
 1where
  is the temporary life expectancy between ages 0 and a, or number of years lived between these ages, and
  is defined as the number of years lost between ages 0 and a for cause of death i.9
Decomposition techniques are standard methods for comparing life expectancies across populations and time, and analysing the age-contributions and cause-contributions to their differences.8 We extracted age-specific death rates, numbers of survivors and person-years from the life tables described above. These values, together with the proportion of deaths for each cause in every age group, were used to obtain the age-specific and cause-specific death rates and contributions that make up the difference in life expectancies for the years between 2000 and 2010.
Results: causes of death analysis
Life years lost analysis
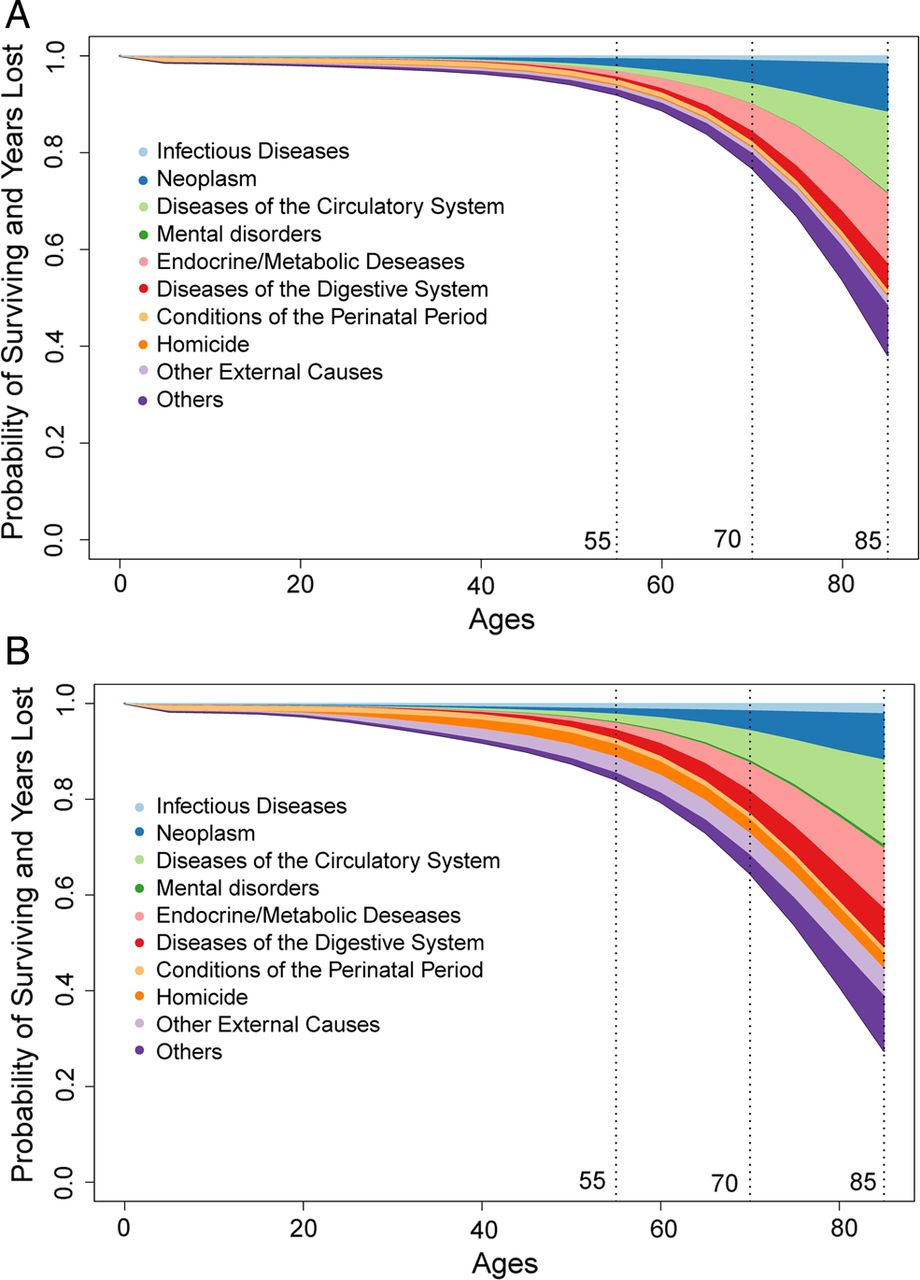
Figure 1A, B presents the survival function as well as the number of life years lost by cause of death for the female and male Mexican population in 2010. After age 55, the rapidly increasing trend of mortality due to CVD, neoplasm and diabetes mellitus is observed in the spread of these coloured bands. For females, external causes of death (including accidents, suicides and homicides) are only moderately present by the age of 55, whereas for males they are among the most important components of life years lost at these young ages.

(A) Mexican female survival function and life years lost due to selected causes of death, depicted by the different colours, in 2010. (B) Mexican male survival function and life years lost due to selected causes of death, depicted by the different colours, in 2010. Sources: Authors’ calculations, data from INEGI. Note: Causes of death used and their specific International Classification of Diseases tenth revision (ICD-10) codes are defined in table 1.
Table 1 presents the life years lost to the 10 selected causes of death, including homicides and diabetes mellitus, in 2000 and 2010 and the difference between these years. In 2000, by the age of 55, Mexican females and males had lost 2 and 3.3 years of life, respectively. In 2010, the years lost due to death between age 0 and 55 had reduced by 0.3 for females and 0.1 for males. While deaths in the first year of life, specifically due to perinatal conditions, contributed substantially to this decline, a slight increase in deaths due to diabetes mellitus, disease of the digestive system and cardiovascular mortality is observed by age 85. For males, by the age of 85, an increase of more than a half-year of life years lost due to homicides was observed, which is even more than the reductions observed in deaths of the perinatal conditions.
Cause-decomposition analysis
To study the changes in mortality in the overall age span, we examine the female and male age and cause-contribution to the change in the Mexican life expectancy at birth between 2000 and 2010. Figure 2A, B presents these decompositions. Between 2000 and 2010, there was a half year increase in the average lifespan for females, changing from 77.2 to 77.8 years; their male counterparts experienced no change in life expectancy, which remained at 72 years. The progress made in bringing down mortality due to perinatal conditions in the first year of life is equivalent to a quarter of a year of increase in life expectancy for both females and males. Advances in the prevention of diseases of the circulatory system and neoplasm between ages 35 and 85 contributed to an increase in female life expectancy of 0.18 and 0.19 years, respectively. For males, diseases of the digestive systems and other external causes for the age groups 25–70 and 40–80, respectively, combined contributed to an increase in life expectancy of 0.4 years. In contrast, endocrine/metabolic diseases, predominantly diabetes mellitus (concentrated in the age groups 40 and more), and homicides (concentrated in the age groups between 15 and 35 years for females and 15 and 60 years for males) opposed the increase in life expectancy for both females and males. This was particularly observed in males, where homicides opposed the increase in life expectancy by 0.6 year and diabetes mellitus by 0.4 year. This entire year of life expectancy lost is equivalent to the gain obtained from all the causes where a substantial decline in mortality was observed: perinatal conditions, mental disorders, disease of the digestive system, infectious diseases and other external causes of death.

(A) Age-contribution and cause-contribution to the 0.59 years of difference in female life expectancy between 2000 (LE=77.2) and 2010 (LE=77.79) in Mexico. The age-specific causes of death that contribute to the increase in the Mexican life expectancy are shown above the (zero) horizontal axis, and the causes of death that oppose this trend are shown below. (B) Age-contribution and cause-contribution to the 0.07 years of difference in male life expectancy between 2000 (LE=71.97) and 2010 (LE=72.04) in Mexico. The age-specific causes of death that contribute to the increase in the Mexican life expectancy are shown above the (zero) horizontal axis, and the causes of death that oppose this trend are shown below. Sources: Authors’ calculations, data from INEGI. Note: Causes of death used and their specific International Classification of Diseases tenth revision (ICD-10) codes are defined in table 1. Legends include the overall contribution of each cause of death to the change in life expectancy (negative contributions correspond to an increase in the cause of death between 2000 and 2010).
Discussion
The impact by excess homicide and diabetes mellitus on mortality in Mexico was studied using two approaches that complement each other. On the one hand, the analysis of the life years lost provides insights to the mortality situation in 2000 and 2010. The footprints of the growing numbers of homicide can be observed there. For this analysis, information for only 2 years is used, specifically 2000 and 2010. To study in detail the accumulated year-to-year impact of changes in causes of death from 2000 to 2010, we further applied the life expectancy decomposition. The decomposition allowed us to quantify the effect of homicides and diabetes mellitus, among other causes, to the change in the Mexican life expectancy during the first decade of the 21st century. Our results highlight the two causes of death that have opposed the increase in life expectancy, particularly for males. The adverse effect of deaths due to homicides and diabetes mellitus matched the progress observed in all other causes and, as a consequence, the male life expectancy stagnated in the first decade of the 21st century.
The impact of catastrophic events in the health of a population is captured without ambiguity in the changes in mortality, or, as studied here, in the changes in life expectancy. The influences of these types of shocks on mortality depend on their intensity, duration and the history of the population where they occur. For example, Japan's triple disaster (earthquake, tsunami and nuclear catastrophe) in 2011 was intense, but its duration was short10 and in a public health context is far less disastrous than for many other countries in the world.11–13 Russia, on the other hand, has had a long and lasting excess mortality, which is now reducing after more than a decade of high levels.14
Mexico, with a population of 112.33 million according to the 2010 Mexican Census,15 has had a total of 139 568 deaths by homicide in the period 2000 to 2010; in 2010 alone, there were 26 133 homicides.7 The intensity and severity of this catastrophic event has increased over time. As for its duration, while there was a clear beginning, its end is unpredictable, although there have been slight signs of a slowing down in violent deaths in recent years: By 2012, the number of homicides had fallen to 24 535 from 26 924 in the previous year.7 Preliminary data for 2013 situates the number of deaths by homicide at 21382. This increase in homicides was unprecedented in Mexico: between 1985 and 2007, a mean annual reduction of 2.1% in deaths by homicide was observed, whereas in 2008 a 60% increase was recorded, followed by a growth of 38.7% in the next year and another of 32.4% in the following one. The level of violent deaths has become so severe that officials in Mexico and the USA have expressed uncertainty about the Mexican state's ability to withstand the effects of this violence.16 Some studies argue that these excess homicide figures are related to the expansion of organised crime activities by drug trafficking bands and the armed response implemented by the administration of the ex-president Calderón (2006–2012),17 specifically as the result of two factors: (1) homicides caused by traffickers battling to take control of a competitive market and (2) casualties and arrests generated by law enforcement operations against traffickers.18
This context is different from those observed in the former Soviet republics, where life expectancy loss has been attributed to causes of death related to alcohol consumption, including homicide.19 ,20 In Russia, the high rate of homicide has particularly been linked to heavy alcohol consumption.21–23 It also differs from other Latin American countries, where homicide levels have been high, and in some cases increasing, over the past decade, but are linked to a history of political and crime-related violence, which has hindered a decline in homicide levels in certain countries.24
The United Nation's Global Study on Homicide shows that, in comparison with other countries and even with the increase of the homicide-related deaths, the homicide rates in Mexico (21.5 homicide deaths per 100 000 population) are much lower than those observed in Honduras (the highest in the world, at 90.4), Venezuela (53.7), Belize (44.7), El Salvador (41.2), Guatemala (39.9), Colombia (30.8) or even Brazil (25.2), but are higher than those recorded for the Russian Federation (9.2), Uruguay (7.9), the USA (4.7), Cuba (4.2) or Canada (1.6).24 The UN study sheds light on the problems posed by the scarce availability of disaggregated data, a factor that undoubtedly affects the lack of studies on the impact on life expectancy in countries with the highest levels of homicide.
At the turn of the century, Mexico was equipped with a good medical and public health system—institutions that brought the country to life expectancy levels of 77 years for women and 72 years for men in 2000.2 In this year, Mexico stood at a critical moment of development with a favourable demographic dividend; in other words, it had the biggest proportion of persons between the ages 15 and 65 (above 60%) in history.25 This age segment is also referred to as the productive age that contributes to the work force and the economy of a country. The negative impact of homicide on the Mexican life expectancy is not numerically evident on reducing the demographic dividend window of opportunity. However, our quantification of violence only shows the extreme result of the development in the latest years, namely its deaths. The social, psychological and physical scars that violence has left in the country are not possible to quantify in such simplistic ways.26
The lack of opportunities for young people (employment and education), added to the great social disparity among socioeconomic status, has catalysed the current crisis in the country.27 Connected to this are the strong fights for territories observed in the past decade by the main drug cartels, and the Mexican government's open war against the cartels.28 In 2012, the Mexicans elected a president from a different party than for the past 12 years. However, the number of violent deaths remains at very high levels.7
On top of the violence crises, the country has also suffered a second public health crisis. Diabetes mellitus-related deaths have increased abruptly against the increase in life expectancy. This disease is highly related to obesity, which in Mexico has reached epidemic levels.29 ,30 In a study that estimates long-term incidence of type 2 diabetes in the Mexican population, the incidence is among the highest reported worldwide and remained with few changes throughout the study period (1990–2008).31 The increase in overweight and obesity in the past decades in Mexico was observed in all age groups with particularly alarming levels for the very young.30 There is uncertainty concerning the true relationship between obesity and mortality; it is not clear how long a person needs to be overweight or obese before it would severely impact mortality.31–33 However, there are forecasts of declining life expectancy due to obesity in the USA,34 and Mexico could follow if the increases in obesity continue.
The limitations of this study should be mentioned. First, the Mexican data are inaccurate with regard to both mortality and population counts that are used for the calculation of death rates and life tables,35 particularly for the older age groups. We overcame this problem by focusing on 5-year age groups and an open age group of 85 years and more. Second, problems exist in the accuracy of the Mexican causes of death data.36 Studies on the validity of medical death certificates in parts of Mexico show flaws in the information on causes of death, particularly for children.37 In the current study, we focused on the broad causes of death and singled out two specific causes of death, homicides and diabetes mellitus that predominantly affect adults. Third, changes in causes of death reporting over time could also be mentioned as problematic in Mexico; however, the ICD-10 chapter level underlying the cause of death codes used in our analysis is reported as capable of returning reliable estimates of the disease burden in the population.38
There is little basis for optimism regarding the future scenarios of the health of the Mexican population based on the first decade of the 21st century. However, the new law on taxation on soda drinks and other food with high concentrates of sugar in Mexico,39 ,40 as well as campaigns to incentivise physical activity,41 might be able to reduce the current levels of obesity and diabetes mellitus. Public health campaigns should address the gender differences in healthcare and healthcare utilisation,42 because some studies have shown that women with diabetes score lower than men on measures of health status and functioning, factors that are likely to affect self-care activities.43 The differential effects on men and women regarding home care for chronically ill adults and seniors, usually a woman's responsibility, should also be acknowledged.44 Furthermore, some studies identified gender differences, where women with diabetes score worse in quality of life and mental well-being measures,45 and the biological differences that seem to explain the higher male incidence of diabetes46 should be taken into account in the design and implementation of such programmes. Reduction of violent deaths, namely homicides, is more complex, and it will be necessary to break the long legacy of the social and health disparities among socioeconomic status that are found at the root of the violent crisis.47
What is already known on this subject
-
Since the 2000s, the Mexican population has experienced a dramatic increase in deaths by homicides, which was particularly observed for men. Simultaneously, diabetes mellitus-related deaths have increased abruptly in Mexico.
What this study adds
-
Owing to diabetes-mellitus and homicides, from 2000 to 2010, the Mexican male life expectancy stagnated, whereas women experienced a modest increase in life expectancy of half a year. The new laws on taxation on food high in sugar, and campaigns to incentivise physical activity, might be able to reduce the current levels of obesity and diabetes mellitus. Reduction of homicides is more complex, given the long legacy of the social and health disparities among socioeconomic status that are found at the root of the violent crisis.
References
Footnotes
-
Contributors VC-R and VMG-G conducted the conception, design, analysis and interpretation of data. VC-R, VMG-G and CJE-C contributed to the drafting, revision of the manuscript and the approval of the final version.
-
Competing interests VC-R's work was supported by the European Research Council—ERC Starting Grant number 240795.
-
Provenance and peer review Not commissioned; externally peer reviewed.
-
Data sharing statement We used free available data and proper citation is included in the reference list for any researcher to have access to it.