Article Text

Abstract
Background Poor vision is associated with lower socioeconomic status, but less is known about its relationship to area deprivation.
Methods The European Prospective Investigation into Cancer and Nutrition study Norfolk Eye Study was a cross-sectional study of 8563 participants with completed eye examinations. Logarithm of the minimum angle of resolution (logMAR) visual acuity (VA) was measured using standard protocols and low vision (LV) was defined as Snellen equivalent (VA) ≤6/12 in the better eye. Uncorrected refractive error (URE) was defined as improvement of VA by 2 logarithm of the minimum angle of resolution lines with pinhole. The lowest 5% of index of multiple deprivation rank was used to define the most deprived areas. The index of multiple deprivation is a composite measure using routine data from seven domains of deprivation to identify the most disadvantaged areas in England. Logistic regression was used to examine univariable and multivariable associations with LV.
Results Ninety-six participants with missing data were excluded, leaving 8467 for analysis (98.9%). The mean age of the study group was 68.7 years (SD=8.1, range=48–92), with 55.1% women. LV was present in 263 participants (3.1%, 95% CI 2.7 to 3.5%). LV was associated with deprivation after adjusting for age, sex, education, social class and cataract surgery (OR=1.7, 95% CI 1.1 to 2.6, p=0.03), but this effect was mitigated by additionally adjusting for URE (OR=1.5, 95% CI 1.0 to 2.4, p=0.09).
Conclusions People with LV are more likely to live in the most deprived areas; this association was independent of socioeconomic status and partly mediated by URE. Targeting URE in deprived areas may reduce health inequalities associated with LV.
- INEQUALITIES
- DEPRIVATION
- OPHTHALMOLOGY
This is an Open Access article distributed in accordance with the Creative Commons Attribution Non Commercial (CC BY-NC 3.0) license, which permits others to distribute, remix, adapt, build upon this work non-commercially, and license their derivative works on different terms, provided the original work is properly cited and the use is non-commercial. See: http://creativecommons.org/licenses/by-nc/3.0/
Statistics from Altmetric.com
Introduction
The WHO has estimated that 285 million people are visually impaired, of which 39 million people are blind.1 In the UK, over 350 000 people are registered blind or partially sighted and over 1.5 million are estimated to live with sight loss that has a significant impact on their daily lives. Poor vision is associated with a range of adverse health outcomes including falls and depression.2–4 The burden of sight loss is predicted to increase due to the ageing population and increasing incidence of diabetes, with nearly a fifth of those over 75 years of age estimated to be blind or partially sighted.5
Deprivation and social determinants are a major cause of poor health.6 Reports from the WHO Commission on Social Determinants of Health have emphasised the link between social and health inequalities. Lower socioeconomic status (SES) has been shown to be associated with a higher risk of morbidity and mortality. International health disparities also exist in eye health, with 90% of the world's visually impaired living in developing countries.7 ,8 There is substantial evidence that an individual's lower SES is associated with visual impairment(VI) 9–11 higher prevalence and incidence of eye disease,12 ,13 and ocular risk factors.14–17 Some studies have found that access to healthcare is an important consideration in the relationship between VI and SES,18 ,19 particularly for uncorrected refractive error (URE);20 however, less is known about its relationship to area deprivation. The impact of individual SES on health can differ from the effects of the local social and physical environment. Studies investigating the relationship between area deprivation and adverse visual outcomes have provided mixed results. Neighbourhood deprivation has been linked to late presentation of glaucoma,16 ,17 acute angle closure incidence21 and variations in provision of eyecare services in the UK.22 ,23 Fraser et al found that people living in more deprived areas were more likely to present in the late stages of glaucoma and that this effect was partly accounted for by optometry access.17 Furthermore, Day et al reported a clear mismatch between areas of deprivation and the location of optometry practices.22 Both the studies of Fraser and Day et al indicated that there was a relationship between deprivation, access to eye care and adverse glaucoma outcomes. However, studies from Australia24 and the UK25 ,26 have failed to demonstrate an association between deprivation and LV. Deprivation was not associated with visual acuity (VA) at presentation in a study of 240 hospital records of patients with exudative age related macular degeneration from two Scottish National Health Trusts. A recent study of routine data has shown that certification of VI was not associated with deprivation;25 although the authors suggested that variations in the registration process may have contributed to their conclusions.
The relationship between individual SES, area deprivation and adverse health outcomes are interlinked and may be interdependent. In the present study the effects of education, social class and area deprivation on LV in the European Prospective Investigation into Cancer and Nutrition study (EPIC)-Norfolk eye study population were examined.
Methods
The EPIC is a 10-country collaborative cohort study investigating lifestyle and nutritional risk factors for cancer. Detailed descriptions of the study methods and recruitment have been reported previously.27 Data from the present study, the EPIC Norfolk Eye Study was collected between 2004 and 2011, and was based on the third round of clinical examinations, which included a full ophthalmic examination and the fourth health and lifestyle questionnaire.28 All participants completed a detailed self-administered health and lifestyle questionnaire and attended a local clinic for a physical examination. The study was approved by the Norfolk Local Research Ethics Committee, adhered to the Declaration of Helsinki and all participants gave written informed consent.
The full methodological details of the third health examination of the EPIC-Norfolk cohort study and the eye examination have been reported previously.28 Monocular VA was measured using a logarithm of the minimum angle of resolution chart (LogMAR) (Precision Vision, LaSalle, Illinois, USA) with the aid of the participant's usual distance correction at 4 m (or 2 m then 1 m if unable to read any letters). Presenting VA in the better eye was taken as the VA for the individual. LV was defined as LogMAR ≥0.3 (Snellen equivalent VA≤6/12). URE was defined as improvement of VA by two lines with pinhole in the better eye. Previous cataract surgery was determined through self-report from ophthalmic history elicited by the nurses before the routine examination, hospital records and clinical examination in those referred to a consultant ophthalmologist as guided by a predefined research protocol. Educational attainment, SES and demographic characteristics were ascertained through a health questionnaire. Educational attainment was recorded and classified into four groups (less than O-level, up to and including O-level, up to and including A-level, university degree or postgraduate qualifications) according to the highest qualification achieved. Social class was recorded using the Registrar General's occupation based classification system: social class I are professionals, class II include managerial and technical occupations, class III is subdivided into non-manual (Class IIInm) and manual skilled (Class IIIm) workers, class IV consists of partly skilled workers and class V are unskilled manual workers. Social class was dichotomised into non-manual (Class I-IIInm) and manual (Class IIIm-V). Deprivation indices for each participant were derived from data linkage of postcodes at the time of the eye examination.
The index of multiple deprivation (IMD) has been used frequently as a measure of relative deprivation to guide resource allocation and provision of services in the UK.29 Deprivation in this context refers to the relative disadvantage an individual experiences living in a certain neighbourhood. The IMD is based on 38 routinely collected indicators, aggregated into seven weighted domains to represent different dimensions of deprivation, namely income, employment, health and disability, education and skills, barriers to housing and services, crime and environment. The aggregate IMD is generated for each local super output area in England. Each local super output area is delineated using data from the 2001 census and has a minimum of 1000 residents, 400 households and an average population of 1500 residents, correlating to a socially homogenous area. The theoretical basis, validity and reliability have been widely discussed.29 The lowest 5% of IMD rank was used to define the most deprived areas in the present study. Centile rankings are commonly used in IMD analysis. Logistic regression was used to examine univariable and multivariable associations with LV.
The data were initially explored through descriptive analysis of variables using t tests for quantitative variables and a χ2 test for categorical variables to compare different groups. Crude associations of LV and IMD measures with potential confounders were explored using univariable logistic regression, tabulation and a χ2 test. A stepwise logistic regression model was used to examine the effect of deprivation on odds of LV. In particular, the effect of URE on the relationship between deprivation and LV was examined. Indicator variables were used with all categorical variables in the multivariable analysis. Age was analysed as a continuous and dichotomous variable (<65 years and ≥65 years), but presented as dichotomous. Potential interactions between IMD and covariates in logistic regression analyses were tested using indicator variables and interaction terms. All statistical analyses were conducted using STATA V.12 (StataCorp, College Station, Texas, USA).
Results
Data from 96 participants (of which 3 had severe VI) were excluded with missing data, leaving 8467 for analysis (98.9%). The mean age of the study group was 68.7 years (SD=8.1, range=48–92), with 55.1% being women.
Table 1 shows a descriptive analysis of deprivation in the present study. The summary IMD showed that older people, women, lower levels of education, evidence of a cataract operation and URE were associated with living in more deprived areas, although only the association with education was statistically significant. Older people and women were more likely to live in the most deprived areas for all domains, but results were statistically significant for older people in the income and employment domains only. Similar results were also observed for education, cataract operation and URE in individual domains compared with the summary IMD. We did not detect any statistically significant associations between the crime and environment domains and eye health outcomes.
Descriptive analysis of 8467 people living in the lowest 5 percentile ranking of index of multiple deprivation (IMD) and individual domains
LV was present in 263 participants (3.1%, 95% CI=2.7 to 3.5%) and was strongly associated with deprivation; people with LV were nearly twice as likely to live in the most deprived areas compared with those with good vision (OR=1.9, 95%CI 1.3 to 3.0, p<0.003). Figure 1 demonstrates that higher proportions of people with lower vision lived in more deprived areas.

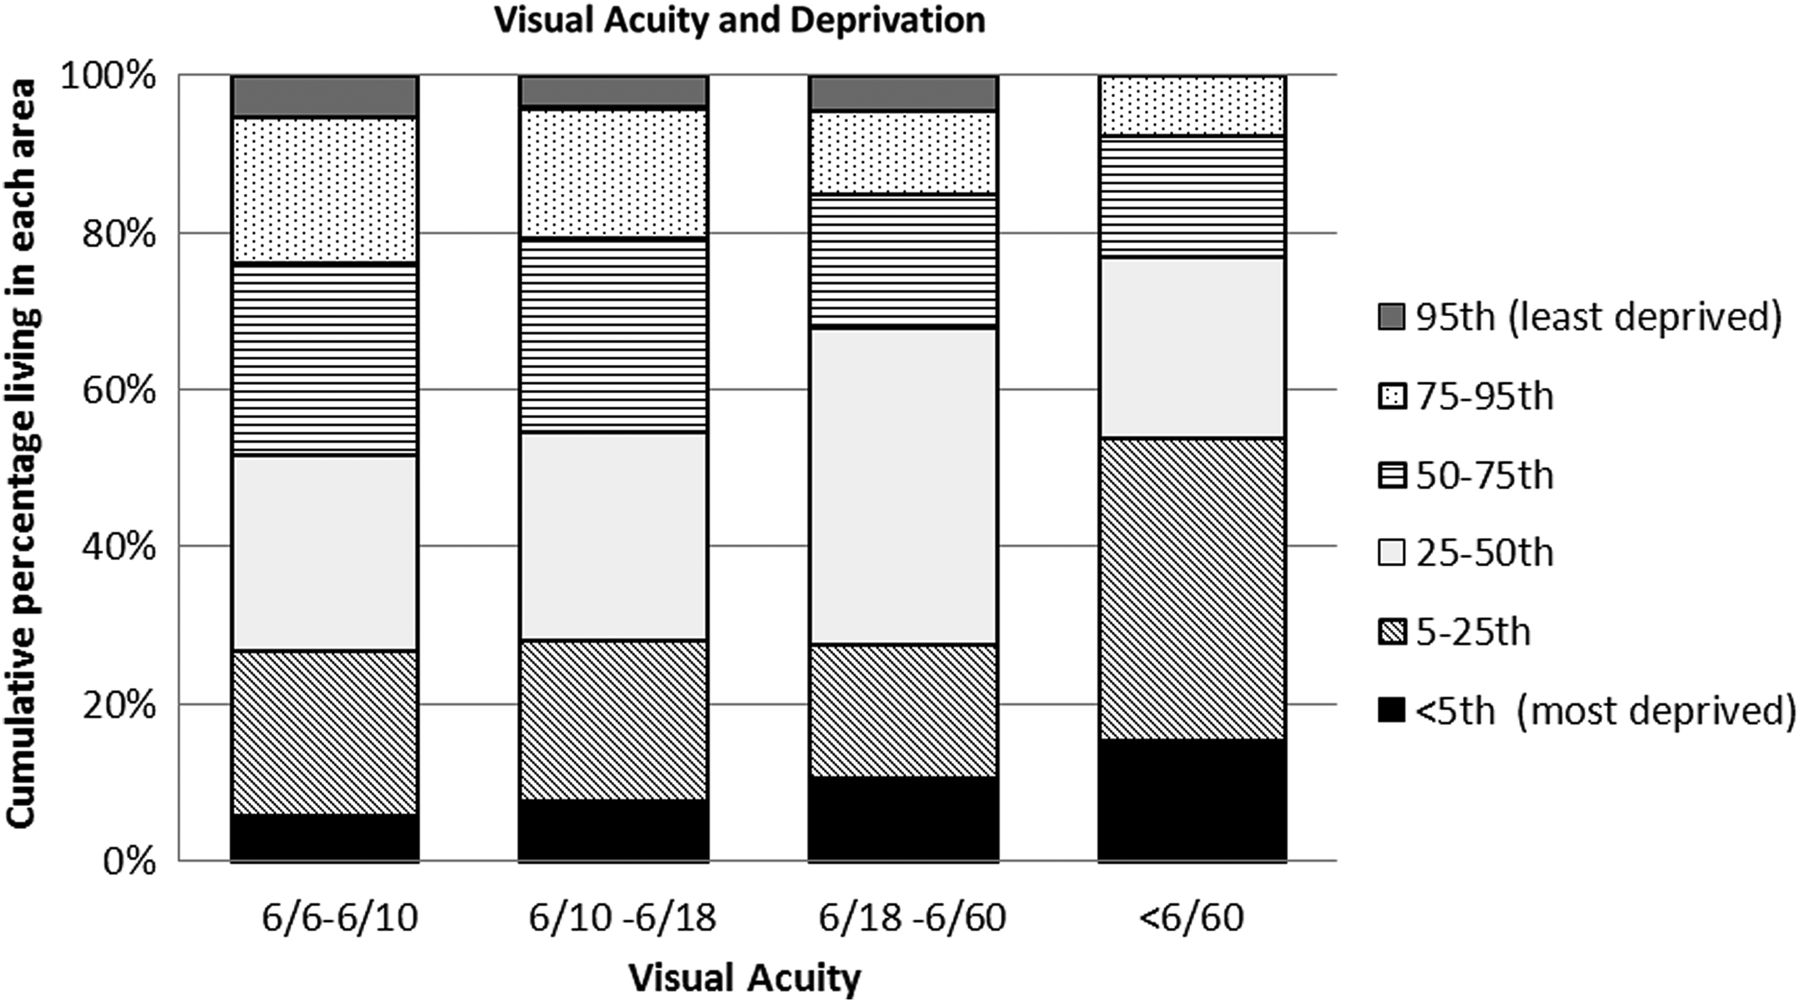
Bar chart of 8563 people showing proportion of people with different visual acuity levels and area deprivation.
URE was present in 13.8% of the study population (95% CI 13.1 to 14.5%) and 11.5% (95% CI 10.8 to 12.2%) of the population had undergone at least one cataract operation. URE and cataract operation were associated with deprivation, though the association was only significant in some individual domains but not the summary IMD. Over 50% of people with LV (Snellen VA≤6/12; 58.2%, 95% CI 52.2 to 64.1%) and VI (Snellen VA≤6/18; 56.7%; 95% CI 43.2 to 69.4%) had URE.
Table 2 shows the univariable and multivariable analyses for odds of LV. People who were older, women, those with lower levels of education and previous cataract operations were more likely to have LV, with those aged ≥65 years being over three times more likely to have LV compared with younger people. People in manual social classes were more likely to be visually impaired (OR=1.20; 95% CI 0.93 to 1.54), although the latter association was not statistically significant, albeit that social class was included in the final models as an a priori confounder. Multivariable analysis showed that LV was associated with deprivation after adjusting for age, gender, education and social class (OR=1.65, 95% CI 1.05 to 2.57, p=0.03); however this effect was mitigated by additionally adjusting for URE (OR=1.52, 95% CI 0.96 to 2.42, p=0.08). Multivariable analysis with six categories of social class did not alter the interpretation of the final models. There was no evidence of interaction between IMD and other covariables on its effect on LV.
Univariable and multivariable associations with low vision (≤6/12)
Discussion
Sight loss is more common in poorer countries,30 ,31 and we have demonstrated that low vision is also more common in the more deprived areas of a developed country. In our large community based eye study, we have shown that people living in the most deprived areas were nearly twice as likely to have LV; this effect was independent of individual educational attainment and social class. Furthermore, deprivation was no longer significantly associated with LV after adjusting for age, gender, education, social class and URE.
Area deprivation has consistently been associated with increased risk of adverse eye health outcomes, such as late presentation of glaucoma,16 ,17 a risk factor for glaucoma blindness. In a hospital based case control study, lower occupational status and longer time since last visit to optometrist were associated with late glaucoma presentation.17 Findings from a health equity audit from Leeds supported these results and also identified fewer optometry practices in areas of high deprivation.22 Similar disparities between health needs and health services were found for diabetic retinopathy.23 The Tudor Hart inverse care law states that availability of good medical care tends to vary inversely with the need of the population, particularly where medical care is exposed to market forces.32 The results from the present study are consistent with the inverse care law and also support the theory that area deprivation and reduced access increase risk of visual loss.
Use of eyecare services is an important consideration in the prevention of blindness, as people who do not access eyecare services are more likely to have lower levels of vision. A population based study of Hispanic participants aged ≥40 years showed that people who had not visited an eyecare provider in the previous 2 years were more than twice as likely to have URE.20 Studies from developed and developing countries have shown that people with fewer resources are less likely to access eyecare services, such as those living in poor areas, who are uninsured or with lower levels of education.33–36 Previous studies, together with the present study, therefore emphasise the importance of access to eye care in tackling the burden of VI. Furthermore, we have highlighted the role of URE and therefore access to optometric services in the relationship between deprivation and LV. Though the individual links between area deprivation and access, access with low vision, and area deprivation and low vision are all well established, this is the first study to link all three factors in one analysis. The association between neighbourhood deprivation and low vision was independent of individual educational attainment and social class, which suggests that deprivation was not an aggregate indicator of individual characteristics, but measures an area level risk factor.
A recent study examining the correlation between IMD and certification of VI found no association,25 although the authors also found an 11-fold variation in registration rates, indicating differences in registration practices and data collection may have resulted in significant measurement error. Certification is not an accurate reflection of prevalence of VI,37 and our study has provided a more accurate picture of the relationship between area deprivation and visual function.
Social deprivation is associated with, and causes, a wide range of adverse health effects. People who live in poverty, or who are unemployed, are at increased risk of premature death.38 Material and psychosocial causes contribute to these health inequalities. For LV, people with fewer resources may not be able to access community optometry services. In the UK, eye tests are free for people aged ≥60 years and there was some evidence in the present study to suggest that younger people were more likely to have URE in the present study, although the interaction term was not statistically significant (OR=5.0, 95% CI 3.7 to 6.5 for age ≥60 years; OR=13.2 95% CI 3.7 to 47.1 for age <60 years adjusting for sex and education).
Several studies have shown independent effects of area deprivation on cardiovascular risk factors such as smoking39 and obesity,40 both of which are also risk factors for chronic eye diseases. Therefore, another possible mechanism mediating the effects of deprivation on LV could be through unhealthy behaviours generated from the local environment, access to services and shared cultures. As with other areas of health outcome, it is also possible that lower levels of social capital could mediate the effect of deprivation and poor vision.41
Older people have been reported to be at greater risk of sight loss5 and in the present study it was found that people aged ≥65 years were nearly three times more likely to have LV after adjusting for age, gender, education, social class, deprivation, previous cataract operation and URE; this suggests that area deprivation and access to health services may only play a small role in the aetiology of LV in older people. The main cause of VI registration in the UK is age-related macular degeneration and studies have suggested that heritability of age-related macular degeneration varies from 45% to 71%.42
People who had undergone previous cataract surgery were more likely to experience LV, but also more likely to live in deprived areas; this is in contrast with the findings of international studies where cataract blindness has been reported to be more common in low and middle income countries and, in addition, to be more common in poorer people in these countries.30 ,31 ,43 In the UK, cataract surgery is freely available on the National Health Service (NHS), although there are different regional prioritisation policies for different funding trusts. However, IMD is used as a tool to allocate resources to local trusts with more funds available to areas of higher deprivation; this may be a source of variation between different trusts. Participants in this study were all funded by the same trust and this would not have played a factor for this association. However, variations in the quality of care in different hospitals may have contributed to the differences in visual outcomes after cataract surgery in this study. People living in deprived areas are more likely to suffer from poor health and more frequent access to health services may allow higher rates of cataract diagnosis and surgery; this would be particularly relevant to people with diabetes who attend retinopathy screening services. Therefore, identification of poorer vision in those individuals that have undergone previous cataract surgery may also reflect a selection bias towards those patients with multiple ophthalmic comorbidities and lower levels of potential vision.
There are limitations with the present study. Low levels of VI (VA≤6/18) were detected in our study (0.07%, 95% CI 0.05 to 0.09%), which indicated a relatively healthy study population. The study was set within a longitudinal cohort and survivors were thus more likely to be healthier than the general population. Nonetheless, although the study prevalence may have differed from population prevalence, the associations detected remain generalisable. We used centiles of IMD rankings within the study population to determine areas with the highest level of relative deprivation and this approach may have missed pockets of rural deprivation, which is prevalent in Norfolk, and we may have underestimated the effect of deprivation on visual outcomes. The potential for an underestimate is highlighted by the finding of only small differences in proportions living in most deprived housing areas between individual socioeconomic indicator categories, compared with other deprivation domains. Furthermore, we cannot determine from our cross-sectional study design whether people living in more deprived areas were at higher risk of LV, or that people with LV were more likely to move to deprived areas.
Improving visual function and addressing URE can significantly increase quality of life for people with LV and potentially reduce adverse health outcomes.44 We have shown that people living in deprived areas are more likely to suffer from LV, and that this is mediated in part, by URE. Targeting URE in more deprived neighbourhoods through interventions such as outreach optometry services may reduce vision related health inequalities. Patients with URE attending optometry services have the added advantage of undergoing screening for additional comorbidity and thus earlier identification of potentially treatable disease.
What is already known on this subject?
-
Lower socioeconomic status is associated with higher levels of visual impairment, higher incidence and prevalence of eye diseases.
-
Access to healthcare is an important consideration in the relationship between visual impairment and socioeconomic status.
-
There are few studies examining the relationship between area deprivation and low vision, some with mixed results.
What this study adds?
-
People living in the most deprived areas are more likely to have low vision.
-
Targeting uncorrected refractive error in deprived areas may reduce health inequalities associated with low vision in the UK.
References
Footnotes
-
Correction notice Open Access license has been updated since it was published Online First.
-
Acknowledgements We would like to thank Mr Pak S Lee for the training of research clinic nursing staff and equipment maintenance.
-
Contributors JLYY analysed and interpreted data and wrote the manuscript. KTK, NJW and PJF conceived the EPIC Norfolk Eye study, contributed to analysis and interpretation of data and to the preparation of the manuscript. DCB, APK, RL, SH were involved with acquisition, analysis and interpretation of data. All authors contributed to the final version of the report. All authors had full access to all the data in the study and had final responsibility for the decision to submit for publication. KTK is the guarantor.
-
Funding EPIC-Norfolk infrastructure and core functions are supported by grants from the Medical Research Council (G1000143) and Cancer Research UK (C864/A14136). The clinic for the third health examination was funded by Research into Ageing (262). Mr Khawaja is a Wellcome Trust Clinical Research Fellow. Mr Foster has received additional support from the Richard Desmond Charitable Trust (via Fight for Sight) and the Department for Health through the award made by the National Institute for Health Research to Moorfields Eye Hospital and the UCL Institute of Ophthalmology for a specialist Biomedical Research Centre for Ophthalmology. None of the funding organisations had a role in the design or conduct of the research.
-
Competing interests None.
-
Ethics approval Norfolk Local Research Ethics Committee.
-
Provenance and peer review Not commissioned; externally peer reviewed.
-
Data sharing statement All data requests and collaborations are reviewed and assessed by the EPIC Norfolk Management Committee.