Article Text

Abstract
Background In the past two decades, health inequality has persisted or increased in states with comprehensive welfare.
Methods We conducted a national registry-based repeated cohort study with a 3-year follow-up between 1990 and 2007 in Sweden. Information on all-cause mortality in all working-age Swedish men and women aged between 30 and 64 years was collected. Data were subjected to temporal trend analysis using joinpoint regression to statistically confirm the trajectories observed.
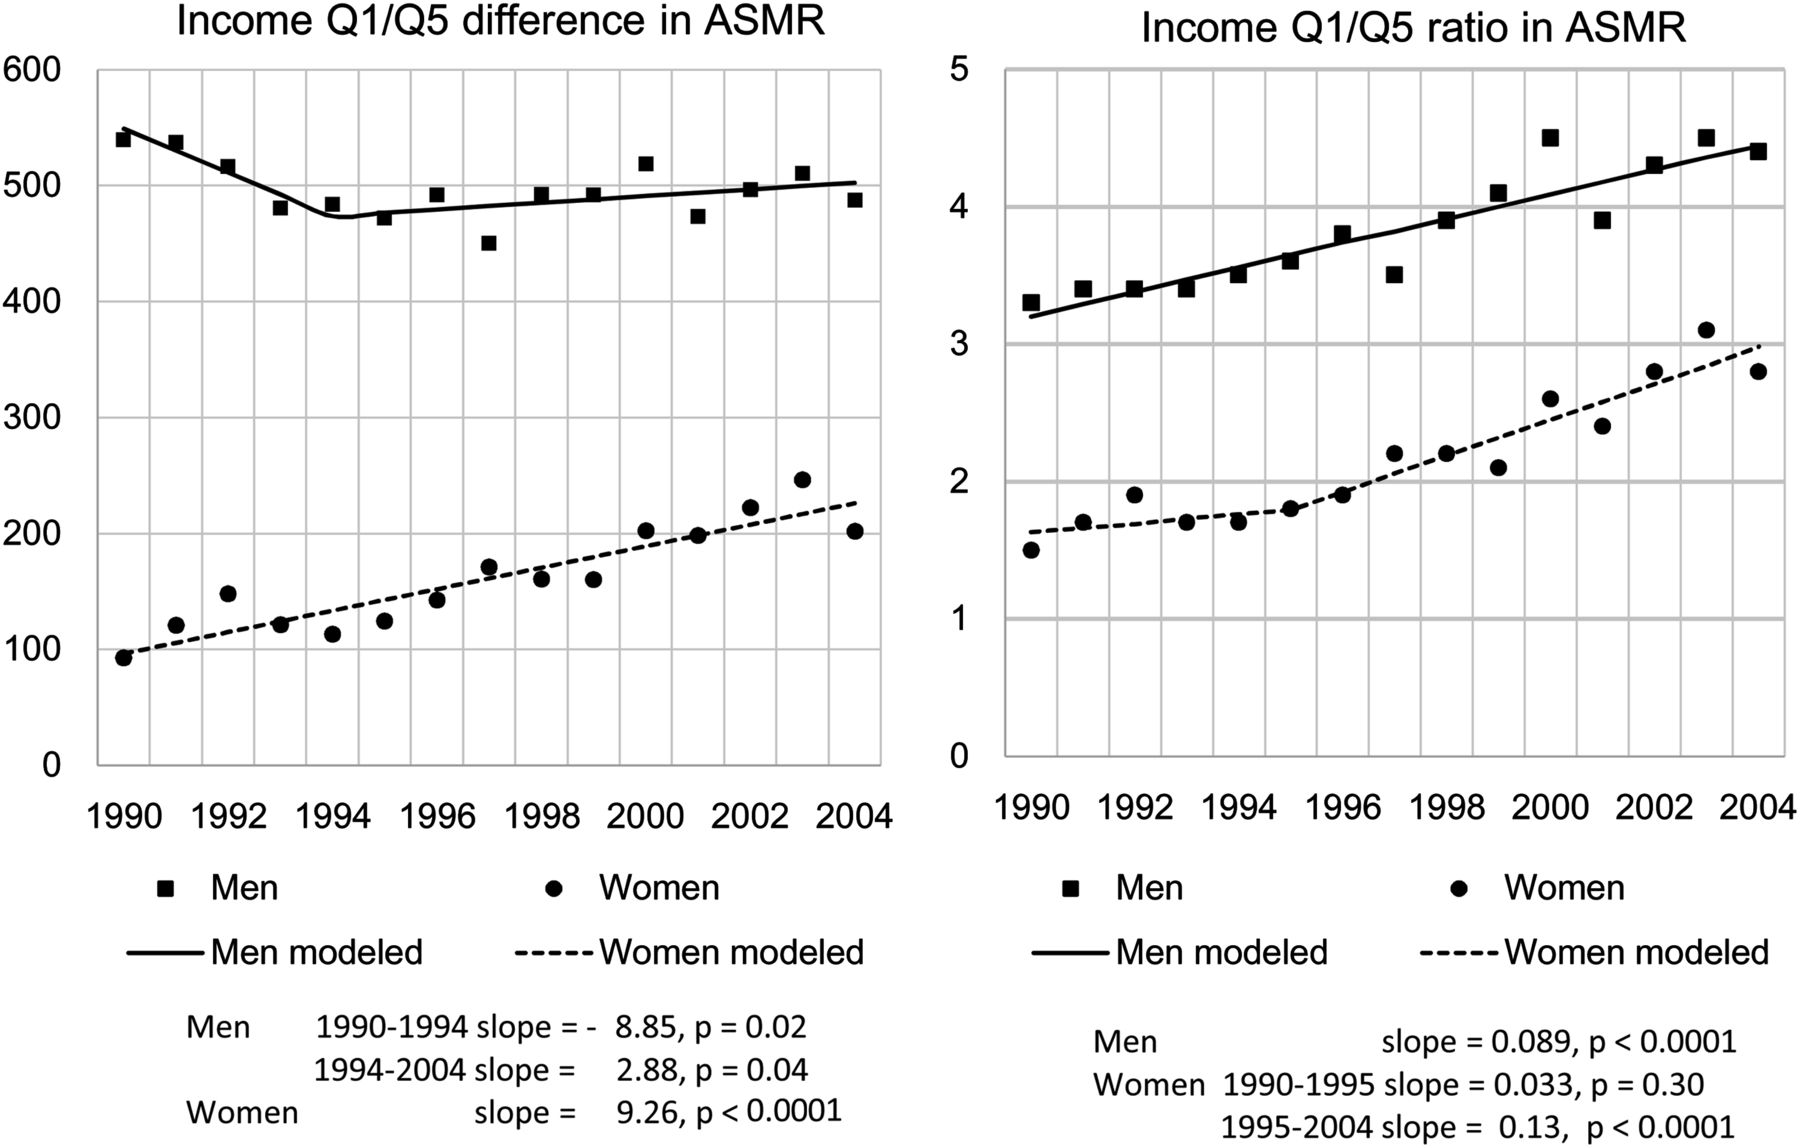
Results Among men, age-standardised mortality rate decreased by 38.3% from 234.9 to 145 (per 100 000 population) over the whole period in the highest income quintile, whereas the reduction was only 18.3% (from 774.5 to 632.5) in the lowest quintile. Among women, mortality decreased by 40% (from 187.4 to 112.5) in the highest income group, but increased by 12.1% (from 280.2 to 314.2) in the poorest income group. Joinpoint regression identified that the differences in age-standardised mortality between the highest and the lowest income quintiles decreased among men by 18.85 annually between 1990 and 1994 (p trend=0.02), whereas it increased later, with a 2.88 point increase per year (p trend <0.0001). Among women, it continuously increased by 9.26/year (p trend <0.0001). In relative terms, age-adjusted mortality rate ratios showed a continuous increase in both genders.
Conclusions Income-based inequalities among working-age male and female Swedes have increased since the late 1990s, whereas in absolute terms the increase was less remarkable among men. Structural and behavioural factors explaining this trend, such as the economic recession in the early 1990s, should be studied further.
- Health inequalities
- POLICY
- SOCIAL CLASS
- SOCIO-ECONOMIC
This is an Open Access article distributed in accordance with the Creative Commons Attribution Non Commercial (CC BY-NC 3.0) license, which permits others to distribute, remix, adapt, build upon this work non-commercially, and license their derivative works on different terms, provided the original work is properly cited and the use is non-commercial. See: http://creativecommons.org/licenses/by-nc/3.0/
Statistics from Altmetric.com
Introduction
Concern has been raised about the public health consequences of the rapid expansion of globalisation since the early 1990s. These include persistent income inequalities, weakened social protection, changing social relationships and increased psychosocial stresses, which are usually discussed in relation to the volatile macroeconomic fluctuations.1–5 For example, an economic recession may contribute to health inequalities, as it is likely to have a disproportionately negative influence on living conditions and health among individuals in socioeconomically disadvantaged populations.6–8 Sweden experienced an economic recession between 1990 and 1994, which was the worst since the 1920s. Unemployment soared from 1.7% to 8.3%. To respond to this crisis, the government introduced a series of macroeconomic reforms, the so-called Crisis Packages, which included tax reforms, cutbacks to social services, unemployment compensation and sick pay.2 These reforms increased the financial and psychosocial burden on the working-age population and, in particular, worsened the situation of the most disadvantaged. At the same time, income inequality also increased faster than anywhere else in the European Union.2
Welfare policy can function as a buffer against financial, occupational and educational constraints during periods of economic hardship. Sweden and other Nordic countries are recognised as societies with generous and universal welfare systems and low income inequality,9 ,10 and early evidence suggested that health inequalities did not widen during the deep recession in the early 1990s.2 ,4 ,11 ,12 However, these studies only used data up until 1995, so longer term observations are lacking. The purpose of this study therefore was to describe the long-term trends in inequalities in mortality across different income groups using a 3-year follow-up repeated cohort study of the total working-age population in Sweden between 1990 and 2007.
Methods
Data
Data were collected from multiple govermental censuses, the population registry and the cause of death registry for the whole of the Swedish working-age population between 1990 and 2007. We adopted this data period for the sake of comparability. Data from 2008 onwards were not available because of the lack of further updates in the database. Information on demographic and socioeconomic status was obtained from the National Population and Housing Censuses, the Total Population Registry (RTB) and the Longitudinal Data Base on Education, Income and Employment (LOUISE). Mortality data were obtained from the National Cause of Death Registry. In accordance with recent relevant studies, we restricted the data to individuals aged 30–64 years, to evaluate the health disparities of people who were actively involved in the labour market.4 ,11 The population included 1 883 651 men and 1 836 890 women in 1993, and 2 022 279 men and 1 970 943 women in 2007. Those individuals with missing data from the National Cause of Death Registry or income data, mostly as a result of moving out of the country, were excluded. Data were missing for 3.37% of the study population in 1993 and 0.097% in 2007.
Measurements
We collected all records of deaths from the National Death Registry, and therefore determined the numbers alive at December 31 of every year. The number of deaths was determined according to age in 5-year intervals, gender and income quintile. The measure of income was the annual individual disposable income 3 years prior to the year when mortality was determined. We stratified data by income quintiles that were calculated for each annual cohort by gender.
Statistical analysis
Calculation of age-standardised mortality rates
First, we calculated mortality rates standardised for the Swedish population in 2000.13 To evaluate the secular trends in mortality disparities across income quintiles, the differences and ratios of age-standardised mortality rates were calculated for lower income quintiles (Q1 and Q2) against the highest quintile (Q5).
We excluded deaths that occurred within 2 years of gathering income information. This was to minimise the confounding effect of existing health conditions, which could have altered both income and the risk of death in the near future.
Trend analysis
Next, we plotted these inequality measures and visually evaluated the secular trends over time. To evaluate the changes in secular trends in the differences in age-standardised mortality rates between income quintiles over time, we conducted a trend analysis using joinpoint regression.14 Joinpoint regression explored the potential points of trend changes in an inductive manner and statistically evaluated whether or not potential point changes in trend were statistically significant. We accounted for potential autocorrelations of errors within each gender over time and the regression coefficients were estimated by weighted least squares. To determine the best fit for each model, we used the grid search methods, creating a ‘grid’ of all possible locations for ‘joinpoints’, or the points where two different trends connected one another, and testing the sum of squared error at each one to find the best possible fit. We used permutation test methods to determine the number of joinpoints, setting a significance level of each individual test as 0.05. A detailed statistical note is available elsewhere.14 ,15 These analyses were performed using the statistical analysis package R V.3.0.3, HD*Calc V.1.2.3 and Joinpoint Regression Program V.4.0.4 (US National Cancer Institute).
Sensitivity analysis
We also calculated other disparity indexes including range difference, between-group variance, absolute concentration index, slope index of inequality, range ratio, index of disparity, mean log deviation, Theil index, relative concentration index and relative index of inequality. Since these disparity measures used parameters which were aggregated, weighted and ranked by income groups, a Taylor series approximation with the Poisson model was used to calculate SEs, formally accounting for those potential issues.16
Results
Overall, mortality rates steadily decreased over time in all age groups among both men and women (table 1, full data in online supplementary table S1). However, among income quintile groups, the lowest income quintile showed different trends; age-standardised mortality rates by income quintile showed a continuous decline in all income groups except for the lowest quintile (figures 1 and 2). Among men in the highest income quintile, age-standardised mortality rates (per 100 000 population) decreased by 38.3% from 234.9 to 145 during the observed period. However, in the lowest income quintile, the rates decreased by only 18.3% from 774.5 to 632.5. Among women, the rates decreased by 40% in the richest quintile, from 187.4 to 112.5, whereas in the lowest quintile it increased by 12.1% from 280.2 to 314.2 (online supplementary figure). Joinpoint regression for the differences in age-standardised mortality rates between income quintiles 1 vs 5 among men selected a 1-joinpoint model, showing that the rate decreased 18.85/100 000 population annually (p for trend=0.02) until the 1994–1997 cohort and then continuously increased by 2.88/year (p for trend <0.04; figure 3). In women, no point of trend change was statistically identified. The final model showed that the mortality differences constantly increased by 9.26/year (p<0.0001). Joinpoint models for the ratios of age-standardised mortality rates between income quintiles 1 vs 5 selected a 0-joinpoint model for men and a 1-joinpoint model for women. For men, the ratio increased by 0.089/year, while among women the annual increase was 0.89 (p for trend=0.30) until 1995 and 0.09 thereafter (p for trend <0.0001). Among women, the increasing trend of mortality disparities was similarly observed in alternative absolute and relative inequality measures. Among men, changes in relative mortality disparities were also constantly shown by alternative measures, whereas the increasing trends were less consistent across alternative absolute measures (online supplementary table S2).
Basic demographic characteristics, number of deaths of the working-age population (30–64 years) and mortality rate (per 100 000 population) in Sweden in selected cohorts (full data available online)

Trends in age-standardised mortality rates by income quintile (Q5 is highest): Swedish men and women aged 30–64 years, 1990–2004. Income data were based on the individual disposable income at a point 3 years prior to death.

Trends in the absolute and relative health inequality indices: Swedish men and women aged 30–64 years, 1990–2004. Error bars represent the 95% CIs. ASMR, age-standardised mortality rate; Q, quintile.
Joinpoint models selected as the regressions on the trends in income-based disparities in age-standardised mortality rates (ASMR) among Swedish men and women aged 30–64 years, 1990–2004 (Q, quintile).
Discussion
After the middle of the 1990s, the rate of reduction in mortality rates in the lowest income groups slowed down among men and increased among women. The trends of overall income-based inequalities reflected these trends in the lowest income groups, especially in absolute terms, suggesting that the absolute inequality trends were largely driven by trends in the lowest income groups. Consequently, mortality differentials by income have widened since around 1995 among men, whereas among women a continuous increase in mortality disparities was observed between 1990 and 2004. The pace of increase in mortality disparities was not fast among men (only 2.88/100 000 population annually), but it might be slightly faster for women (annual increase=9.26) than men. In relative terms, the mortality inequality across income groups showed a continuous rise in both genders. Lundberg et al12 compared the periods 1986–1987 and 1994–1995 in terms of the gaps in self-rated health across different sociodemographic groups, but did not find any widening of health disparities. Similar results were obtained in other studies in Sweden and other Nordic countries.10 ,17 The advantages of the present study over these are that it used register-based data with very little missing data for the entire Swedish working-age population over more years, it had more objective health outcome measures (mortality) and it used register-based total population data. Our study added new findings: increasing income-based inequality in mortality in the working-age population that had important implications compared with earlier studies in Scandinavia.
We found a potentially changing trend in mortality among the male cohorts after 1994, with a subsequent continuous increase in mortality inequality among the working-age population. Possible explanations for the trends are as follows. First, it may be associated with the economic recession of the early 1990s. An economic recession may directly affect individual socioeconomic and living conditions, influencing physical and mental health, and changing behaviour that influences health (eg, diet, smoking, drinking and healthcare utilisation). In Sweden, however, the economy and the labour market recovered before the mortality inequality started to increase after 1995. Therefore, the widening inequalities in income-related mortality do not seem to be fully attributable to the direct effects of the recession.2 Second, macroeconomic structural reforms to ameliorate the recession may account for the trend observed. Several studies have shown increasing health inequalities or deteriorating health in specific social groups during and after recessions.6–8 ,11 Third, the expanding health inequality may be attributable to other factors that occurred parallel to the recession and subsequent sociopolitical changes. It is known that widening health disparities are a recent global trend and have been observed even in countries with continual economic development, though potential factors attributable to this global trend have rarely been investigated.5
Critically, we found that the widening mortality inequality was mostly attributed to increasing mortality rates among the poorest quintile. This may be explained by ‘materialistic’ and ‘psychosocial’ pathways.18 ,19 Materialistic pathways relate to increased mortality among the poorest, which may be associated with weakened social protection for the financially vulnerable, including cutbacks in social services, unemployment compensation or sick pay, potentially leading to less access to benefits and services necessary to maintain health.2 Psychosocial pathways relate to increased psychosocial stresses, perhaps because income inequality continued to expand from the 1990s,2 leading to a greater sense of relative deprivation among the poorest group.20–25 Another possibility is a reverse causation, that is, unhealthy individuals may have experienced income reductions before they died. Weakened social protection may negatively affect the ability of ill individuals (eg, having chronic diseases such as diabetes) to continue working and earn income. Downward income mobility due to poor health may explain our findings to some extent. We tried to address this problem in part by excluding deaths occurring in the first 2 years of follow-up. Moreover, there could be compositional changes in the income groups over time. For example, the absolute standing of each income group today may be different from that in earlier years. To address these issues, more sophisticated approaches, for example, a longitudinal panel data analysis using continuous income data, would be necessary.26
The relative increase in mortality rates among the lowest income quintile was larger for women than for men (online supplementary figure). This is consistent with the results of recent studies which showed faster expansion of education-based inequalities in life expectancy among women than men.27–29 Although further studies of these potential gender differences are required, we speculate that they may be associated with gender differences in working conditions. That is, although welfare benefits have been equal for men and women in Sweden, more women worked in the public sector, which was particularly affected by governmental cutbacks.30 In the late 1990s, the number of women on long-term sick leave because of job-related mental illnesses increased dramatically. Vingård et al31 reported that a strained financial situation and excess physical and mental demands at work were the leading risk factors for this change.
In addition to the aforementioned limitations, residual confounding by factors affecting health over the life course is also likely, including education, parental influence and lifestyle. Another point to consider carefully is that the living standard or material conditions of participants in the same income quintile may have changed over time. For example, the lowest income group today may be comparable to the income standing of the middle or highest groups in earlier years. Possible solutions are to account for price inflation (eg, using purchasing power parity) and the use of continuous and individually followed up longitudinal income data. Nonetheless, income also reflects the relative social status in a society, which should also be associated with health.20–25 Therefore, in this descriptive study, we created income quintiles without adjusting for price inflation over time. Owing to the lack of household information (eg, spousal and partner information) in the registry data, individual income was used in the study, which could also involve some limitations. It is possible that individuals make decisions in joint households, and an individual with a low individual income may in fact belong to the top income category in terms of consumption. Nevertheless, Sweden has a very high rate of female employment (over 80%), and we thus believe that individual disposable income may still, to a great extent, reflect economic activity, material conditions and relative social status.25 Nonetheless, further careful interpretation would be needed for our results as women have weaker labour attachment, particularly for older ages in the earlier periods, limiting comparability in health disparities over time among women. Moreover, trends in income-based inequality in mortality may vary across diseases and causes of death. For example, there is evidence that macroeconomic hardships may predict increased deaths from suicide but not from other causes (eg, accidental deaths), though the evidence on the associations between business cycle and mortality by different causes has been rather mixed.11 ,32–36 In the future, studies of cause-specific income-related mortality should be examined further, with a more robust and comprehensive analytic design in terms of testing causal associations. Trends in younger and older age groups should also be evaluated.
In conclusion, in Sweden, along with other developed countries,37 health inequalities of working-age men and women have persisted and have widened since the 1990s despite a generous welfare system and good overall population health. This suggests that universal and comprehensive welfare systems may not be sufficient to buffer the whole population from the recent global trend of widening health inequalities.38 To amend the current trend, countermeasures might be needed to improve the lives of working-age men and women, which should be with ‘a scale and intensity that is proportionate to the level of disadvantage’ (the Marmot Review).39 Continuous monitoring of health disparities is crucial in any society, to prevent and address the unacceptable expansion in these disparities.
What is already known on this subject
Persistent or even increasing health inequality has been observed since the 1990s in many developed countries.
In Sweden, short-term evaluation studies have shown no expansion of health inequalities by income in the 1990s, when the country experienced its economic recession since 1930.
What this study adds
Reductions in mortality rates of working-age men and women in the lowest income quintile were slower than those with higher incomes between 1990 and 2007.
Consequently, income-based inequality in mortality rates increased by 32% among men and 87% among women over this period, in relative terms.
The recent trend of increasing health inequality may exist even in countries like Sweden with good welfare provision.
References
Supplementary materials
Supplementary Data
This web only file has been produced by the BMJ Publishing Group from an electronic file supplied by the author(s) and has not been edited for content.
Files in this Data Supplement:
- Data supplement 1 - Online supplement
Footnotes
Contributors NK was responsible for the study conception, design, analysis and interpretation of data, as well as the drafting of the article. MÅY and MR supported NK in study conception and drafted and intensively revised the manuscript.
Funding Ministry of Education, Culture, Sports, Science and Technology, MEXT, Japan (No: 25253052), Ministry of Health, Labour and WElfare, Japan (H24-chikyukibo-ippan-009); Stiftelsen Riksbankens Jubileumsfond.
Competing interests NK had support from the Ministry of Education, Culture, Sports, Science and Technology, MEXT, Japan (No: 25253052) and Ministry of Health, Labour and WElfare, Japan (H24-chikyukibo-ippan-009) for the submitted work. MÅY had support from Stiftelsen Riksbankens Jubileumsfond, Sweden and MR had support from the Swedish Research Council (grant no. VR 421-2011-1649).
Ethics approval Ethical permission (no 02-481) was provided by the Regional Ethics Committee at Karolinska Institutet in Stockholm.
Provenance and peer review Not commissioned; externally peer reviewed.
Authors’ access to data All authors had full access to all of the data in the study and can take responsibility for the integrity of the data and the accuracy of the data analysis.