Article Text

Abstract
Background Socioeconomic inequalities are a key policy challenge. Studies to date have not taken a unified approach to assess how socioeconomic inequalities in health, behaviour and educational attainment change as children age.
Methods We examined maternal education inequalities in multiple offspring health, behavioural and educational outcomes and how these changed across childhood and adolescence in the Avon Longitudinal Study of Parents and Children, a cohort born in 1991/1992 in South-West England (N=5560–11 463).
Results Inequalities were observed for some health measures (blood pressure (BP), height, cholesterol, bone mineral density (BMD) and fat-mass (females)) but not in other measures (parent-assessed child health, triglycerides, fat-mass (males), high-density lipoprotein-cholesterol, C reactive protein). The strongest health inequality was systolic BP (mean difference comparing highest to lowest maternal education −0.28 SD (95% CI −0.35 to −0.20), approximately 2.6 mm Hg. Wide inequalities, similar in magnitude to BP, were observed for behavioural outcomes. Even greater inequalities were observed for offspring academic achievement (mean difference comparing highest to lowest maternal education 1.43 SD (95% CI 1.37 to 1.50), a difference of 22%). For all behavioural outcomes and some health indicators, inequality was stable over childhood. For some outcomes (BP, BMD and most education outcomes), inequality narrowed as children got older. Only for height and attainment in English tests was there evidence of widening inequalities with age.
Conclusions Our results suggest that within this cohort, maternal education inequalities in offspring health, behaviour and educational attainment are established in childhood but do not increase up to adolescence. Maternal education inequalities in behaviour and educational attainment were considerably larger than in health measures.
- Inequalities
- Child Health
- Epidemiology
- Longitudinal Studies
- Social Epidemiology
This is an open-access article distributed under the terms of the Creative Commons Attribution Non-commercial License, which permits use, distribution, and reproduction in any medium, provided the original work is properly cited, the use is non commercial and is otherwise in compliance with the license. See: http://creativecommons.org/licenses/by-nc/3.0/ and http://creativecommons.org/licenses/by-nc/3.0/legalcode
Statistics from Altmetric.com
Introduction
Socioeconomic inequalities in health remain as one of the biggest challenges to health policy. An emerging evidence base demonstrates socioeconomic inequalities in health in childhood and adolescence,1 a relationship between socioeconomic position (SEP) in childhood and health in adulthood,2 ,3 and the existence of inequalities in childhood behavioural problems4 ,5 and educational attainment.5 Thus, it is possible that inequalities in adult health may be already determined in childhood and may be accentuated by socioeconomic inequalities in behaviour and educational attainment in childhood/adolescence. Some studies show widening of socioeconomic inequalities in health across childhood.6–8 However, this finding is not universal.7 ,9–12 While differences in geographical setting and birth year of study participants may explain some of the differences between study findings, methodological factors could also be important.
Much of the existing literature on changes in socioeconomic inequalities over childhood uses cross-sectional studies and examines whether inequalities differ for children of varying ages.6–12 Any age effects seen in such analyses could result from cohort effects, that is, they may be driven by differences between different birth cohorts rather than by differences in age. Most studies also focus on a limited number of health indicators and do not explore how socioeconomic inequality patterns are similar (or not) to those of behaviour or educational attainment. Our aim is to compare socioeconomic inequalities during childhood, and how they change as children age, across multiple domains of childhood: health, behaviour and educational attainment. The larger the inequalities and the more they widen, the more likely are they as precursors of adult health inequalities, and therefore important targets for policies.
Methods
Data
The Avon Longitudinal Study of Parents and Children (ALSPAC) is a prospective cohort study.13 ,14 Pregnant women resident in one of the three Bristol-based health districts with an expected date of delivery between 1 April 1991 and 31 December 1992 were invited to take part. From the 14 541 women recruited, 13 988 children were alive at 1 year. Ethical approval was obtained from the ALSPAC Law and Ethics Committee and the Local Research Ethics Committees.
We analyse outcomes from as close as possible to birth/infancy, 7, 9, 11 and 15 years, although exact ages and number of measurement occasions vary between outcomes as detailed below.
Socioeconomic position
We use maternal education as the measure of SEP. Analyses with paternal education, head of household occupational class and family income as the measure of SEP produced very similar results to those for maternal education (results available from authors) and therefore we present associations with maternal education only.
A questionnaire at 32 weeks of gestation asked mothers to report their educational attainment, which was categorised as below O-level (ordinary level; examinations taken in different subjects usually at age 15–16 at the completion of legally required school attendance; equivalent to today's UK General Certificate of Secondary Education), O-level only, A-level (advanced-level; examinations taken in different subjects usually at age 18), or university degree and above.
Health indicators
Offspring health indicators are parent-assessed overall child health (higher scores indicate worse health), height, total body fat-mass assessed by whole body dual x-ray accelerometry scan, blood lipids (triglycerides, high-density lipoprotein cholesterol (HDLc) and serum total cholesterol (hereafter referred to as ‘cholesterol’)), C reactive protein (CRP), systolic and diastolic blood pressure (SBP and DBP) and total body-less-head bone mineral density (BMD). Full measurement details are provided in online supplementary material.
Behavioural outcomes
Caregivers were asked in self-completed questionnaires to rate their child's behaviour and conduct using the Strengths and Difficulties Questionnaire. Full details are provided in online supplementary material. Answers are grouped into scores for total difficulties, hyperactivity-inattention, emotional, conduct and peer problems.
Educational outcomes
We use scores in nationally set examinations as measures of offspring educational attainment in English, mathematics and science, and an overall summary of these. Full details are provided in the online supplementary material.
Choice of outcomes
We wished to examine a range of outcomes covering different domains of childhood: health, behaviour and education. We a priori selected the outcomes from a large range of measurements available in ALSPAC on the basis of their known associations with adult disease and key socioeconomic achievements/outcomes. The childhood health indicators track strongly across the life course15–18 and have all been associated with key chronic diseases in adulthood (cardiovascular disease, diabetes and osteoporosis/fractures) that are known to be associated with SEP.19–25 Taller height is associated with both socioeconomic and health advantage.21 Lower levels of fat mass, cholesterol, triglycerides, CRP, SBP, DBP and higher levels of HDLc are advantageous for cardiovascular health. Higher levels of BMD are associated with lower risk of osteoporosis. Parent-assessed overall child health (higher scores indicating worse health) is similar to a self-report assessment of general health that in adults is associated with premature mortality and a wide range of chronic diseases and is strongly socioeconomically patterned.11 ,26 The behavioural outcomes we analyse (higher scores indicating more difficulties) are associated with future mental-health problems in adults,27 and educational attainment is predictive of later income, occupation, health and other adult outcomes.28
Statistical analyses
Maternal education data are available for 12 493 ALSPAC participants (89% of those alive at 1 year). For each outcome, analysis is restricted to individuals with data on the outcome for at least one of our time points.
Total fat-mass, triglycerides and CRP were right-skewed so natural logs were used in all analyses.
We fit random-effects linear regression models of each outcome on a rank score of maternal education, including an interaction term between maternal education and age (using ages 0, 7, 9, 11 and 15 years as appropriate for the measurement schedule of the outcome and centred on the first age of measurement for a given outcome). We use the Stata command xtreg, and calculate 95% CIs using robust SEs. This allows for the clustering of repeat outcome measures within individuals and also enables us to use all available measures for all eligible individuals with the outcome measured on at least one occasion (under a missing at random assumption). The random effects model produces two results for each outcome: the coefficient for the rank score of maternal education, which is the slope index of inequality (SII, mean difference in outcome comparing highest to lowest maternal education at the first age of assessment for a given outcome) and the coefficient for the interaction between the rank score of maternal education and age, which is a measure of change in the SII per year of greater age (model details in online supplementary material).
Examination of stratum-specific coefficients, together with statistical tests for interaction, demonstrated evidence of gender differences in the maternal education-outcome associations for fat-mass, HDLc, CRP and hyperactivity but not for other outcomes. For these outcomes, analyses are presented separately for males and females. For other outcomes, analyses are presented with data from males and females combined and with adjustment for gender. All analyses are adjusted for the child's exact age (weeks) at outcome measurement.
To facilitate comparisons between outcomes and to allow for the changing scale of some outcomes over age, all outcomes are standardised to mean of zero, variance of one by subtracting the mean and dividing by the SD within age and gender categories. SIIs are therefore the mean difference in SD units of the outcome comparing highest with lowest maternal education.
Sensitivity analyses
To explore whether any changes in inequality across time are linear, we plot the SII at each age. To examine deviation from a linear association between categories of maternal education and outcomes, we plot the trajectory of each outcome across each category. To explore any consequences of missing data, analyses were repeated using three alternative approaches in addition to our main analysis using data from all individuals with one or more measures for a given outcome: (1) restricting to individuals with at least two measures for a given outcome, (2) restricting to individuals with complete data for at all time points for a given outcome and (3) using multivariate multiple imputation (details in online supplementary material).
Results
Sample characteristics
Sample sizes varied from 5560 (blood-based outcomes) to 11 463 (height) (table 1). Approximately 23% of participants had mothers in the lowest educational group (less than O-level) and 15% had mothers educated to a degree level (table 2).
Distributions of outcome measures and sample size at each age
Socioeconomic position of individuals included in analyses of inequalities in fat-mass and comparison with ALSPAC participants not included in analyses
Socioeconomic inequalities
For the offspring health measures, higher maternal education was associated with taller height, lower fat-mass (females only), lower cholesterol, SBP and DBP and higher BMD (table 3 and figure 1). There was little inequality in fat-mass (males only), triglycerides, HDLc or CRP. Children from higher maternal education families had slightly worse overall parent-reported health (higher score), but the CI included the null value. The physical health measures with the greatest inequality were fat-mass (females only) and BP; children with the highest compared with lowest maternal education had SBP on average 0.28 SD lower (95% CI −0.35 to −0.20), which represents a difference of 2.6 mm Hg.
Socioeconomic inequalities in child health measures, and changes in these over childhood

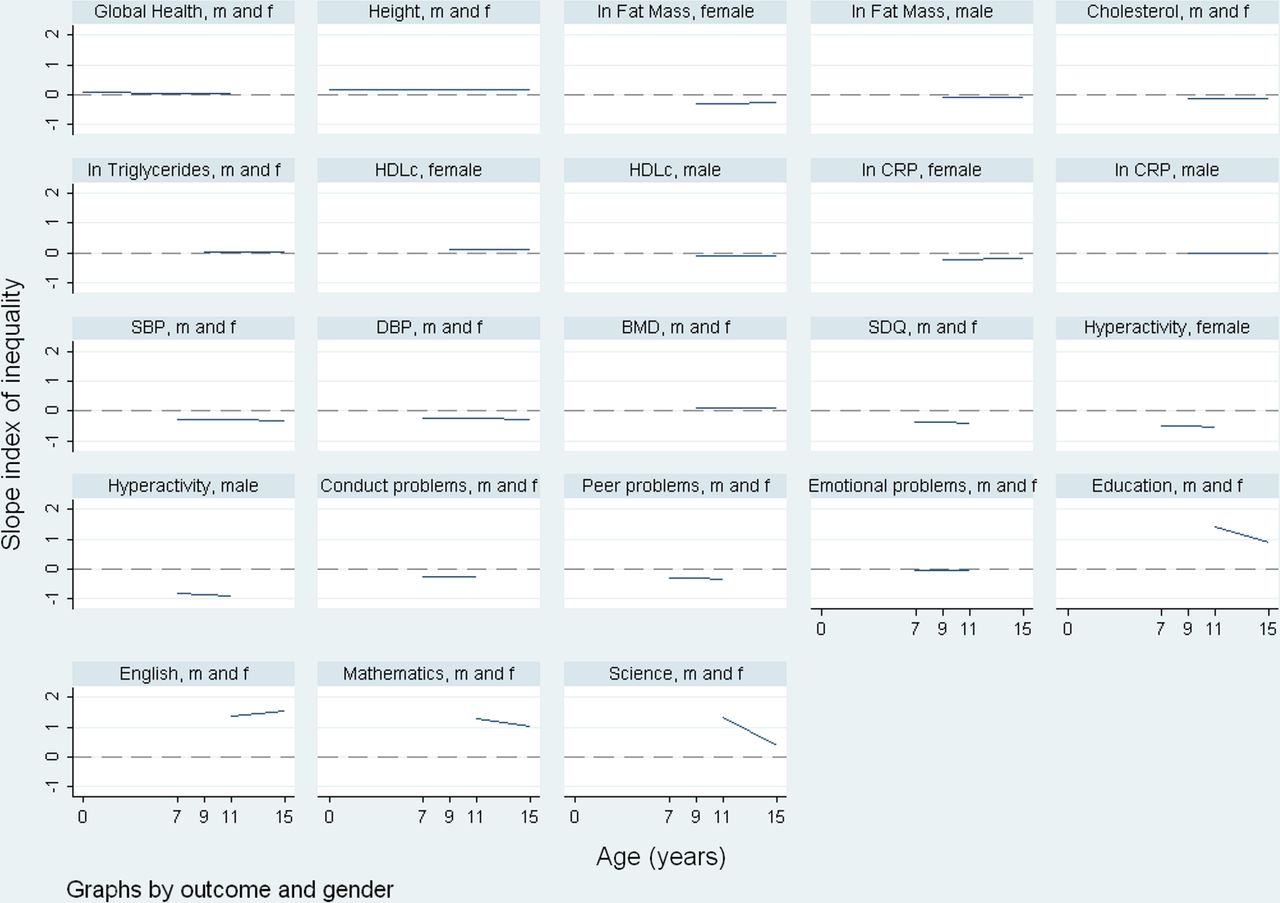
The SII (slope index of inequality) is plotted against age for each outcome. All outcomes are standardised to have a mean of zero and a variance of one. The SII is the mean difference in SDs of the outcome between the highest and lowest maternal education. Graphs are presented for males and females combined ‘m and f’ if no evidence of gender interactions was found, or separately for males and females for outcomes where there was evidence of gender differences in the association with maternal education. Abbreviations of outcome names: BMD, bone mineral density; CRP, C reactive protein; DBP, diastolic blood pressure; HDLc, high-density lipoprotein cholesterol, SBP, systolic blood pressure; SDQ, summary score of behavioural difficulties measured by the strengths and difficulties questionnaire, education, summary score of attainment in tests in English, mathematics and science. This figure is only reproduced in colour in the online version.
Socioeconomic inequalities in behavioural outcomes were generally of a similar or greater magnitude to inequalities in SBP (table 4 and figure 1). Higher maternal education was associated with lower total difficulties in the child of 0.39 SD (95% CI −0.47 to −0.31 SD), hyperactivity of 0.35 SD in males (95% CI −0.46 to −0.23) and 0.51 SD in females (95% CI −0.62 to −0.39), conduct problems of 0.26 SD (95% CI −0.34 to −0.18) and peer problems of 0.30 SD (95% CI −0.38 to −0.22). A 0.39 SD difference for total difficulties equates to a higher overall difficulty of 1.7 points out of a possible total 40. There was no evidence of socioeconomic inequalities in emotional problems.
Socioeconomic inequalities in behavioural measures and educational attainment, and changes in these over childhood
Socioeconomic inequalities were greatest for offspring educational attainment (table 4 and figure 1). Going from lowest to highest maternal education was associated with an increase in overall offspring educational attainment of 1.43 SD (95% CI 1.37 to 1.50); this equates to a difference of 22%. Wide socioeconomic inequalities were evident for all three subdomains of offspring educational attainment, ranging from 1.28 SD (95% CI 1.21 to 1.34) for mathematics to 1.36 SD (95% CI 1.30 to 1.43) for English.
Changes in socioeconomic inequalities over childhood and adolescence
Maternal education differences in offspring cholesterol, SBP, DBP and BMD narrowed as the children got older (table 3 and figure 1). For cholesterol, the socioeconomic inequality that was apparent at age 9 had disappeared by age 15 (figure 1 and online supplementary figure S1). For BP, maternal education differences were static between ages 7 and 9 years, and then narrowed between 9 and 11 and again between 11 and 15 years (see online supplementary figure S1). There was evidence of slight widening of socioeconomic inequalities in height with age; when the coefficients are examined graphically, this appeared to be driven by increasing height inequality between ages 11 and 15 (see online supplementary figure S1). Although the statistical evidence for changes in maternal education differences in total body fat-mass and CRP was weak for females (p=0.1 for fat-mass and p=0.1 for CRP, table 3) the graph showed that for females the inequalities widened slightly with age (see online supplementary figure S1); in males there were only weak socioeconomic differences at any age. There was no evidence for changes with age for socioeconomic inequalities in overall parent-assessed child health, triglycerides or HDLc; inequalities in these were weak at all ages.
For most of the behavioural outcomes, there was no evidence of change in socioeconomic differences as the children got older; inequalities in total difficulties, hyperactivity and conduct problems remained similar across childhood (table 4, figure 1 and online supplementary figure S1). Socioeconomic inequalities in peer problems reduced slightly as children got older, with each increasing year closing the gap by on average 0.03 SD (95% CI 0.01 to 0.06). Overall there was little evidence of socioeconomic inequalities in emotional problems, but this is the only behavioural outcome for which maternal education differences widened as children get older (table 4, figure 1 and online supplementary figure S1).
Maternal education inequalities in offspring educational attainment mostly decreased in magnitude as the children aged. With each year, maternal educational differences in overall offspring educational attainment decreased by 0.09 SD (95% CI −0.11 to −0.08) (table 4, figure 1 and online supplementary figure S1). Socioeconomic inequalities in offspring attainment in mathematics and science tests also narrowed as children got older, with the most narrowing for science scores. There was a slight widening in socioeconomic inequalities in offspring English test scores. However, for all offspring educational outcomes, socioeconomic inequalities remained large at all ages.
Sensitivity analyses
For most offspring outcomes, the differences in outcomes between maternal education categories and how these changes over time are linear across the four SEP categories (see online supplementary figure S2). One notable exception, however, is cholesterol. Levels of cholesterol increase with age for the two higher maternal education categories, but remain stable for the lower two categories. Maternal education differences in peer problems appear to be driven by differences between the lowest maternal education category (<O-level) and all other categories, whereas socioeconomic inequalities for fat mass in males are driven by differences between the highest maternal education category (degree) and all others. Emotional problems decrease with age for the highest maternal education category (degree) but increase for all other categories. Our results and conclusions were robust to sensitivity analysis for different ways of treating missing data (see online supplementary table S1).
Discussion
We have assessed childhood socioeconomic inequalities and how these change with increasing age, for a range of health, behavioural and educational outcomes within a birth cohort from the UK, born in 1991/1992. We find strong socioeconomic inequalities in most outcomes but, in contrast to some hypotheses,6 little evidence that inequality widens as children get older. Socioeconomic inequalities in many of the outcomes we study remained stable over childhood and adolescence, and inequalities in other outcomes narrowed. Only maternal education differences in offspring height and educational attainment in English widened as children got older but, even for these, the change with age was small. The lack of widening of socioeconomic inequalities in offspring educational attainment is in contrast to previous research, which demonstrated that children from wealthy families who scored poorly in early educational tests tended to catch up, whereas children from poorer families did not catch up,29 although recent research suggests this finding may be at least partially due to regression to the mean, and that once appropriate analysis techniques are used inequalities in educational attainment may be large but fairly stable across childhood.30
Differences in magnitudes of socioeconomic inequalities between health, behavioural and educational outcomes in childhood
We utilised standardised measures across a range of outcomes for a single cohort. This allows comparison of socioeconomic inequalities across outcomes. Socioeconomic inequalities were by far greatest for offspring educational attainment compared with other outcomes. Strong socioeconomic inequalities were also observed for behavioural outcomes. Maternal education differences in offspring health indicators were absent or less pronounced, and sometimes decreased as children got older.
The weaker socioeconomic inequalities in health, compared with behavioural or educational outcomes, may be due to SEP having an immediate and direct effect on behaviour and education in childhood but a lagged effect on physical health. Effects on health indicators may emerge later in life, in part through indirect pathways related to the impact of behavioural difficulties and education on lifestyle behaviours that impact on health.
The differences in patterns of change in socioeconomic inequality between types of outcome could hint at underlying mechanisms and life course models. For example, socioeconomic inequalities in behavioural outcomes were stable across childhood and adolescence suggesting that these are established very early in life and that school factors may not succeed in narrowing these differences. The narrowing in BP and BMD socioeconomic inequalities is consistent with the theory that there is equalisation of health during adolescence,11 although support for this is tempered by the fact we did not observe this pattern for other outcomes. For BP and BMD, we need postadolescent measurements in this cohort to determine whether these socioeconomic inequalities re-emerge after this period.
Study strengths and limitations
The key strengths of this study are its large sample size, the use of repeat measurements of outcomes across childhood and the comparison of socioeconomic inequalities across a range of different outcomes. As is common in prospective birth cohort there has been attrition over time, leading to a reduced sample size and a more socioeconomically advantaged group of participants at older ages, which may lead to underestimation of the extent of socioeconomic inequalities.31 However, our analysis strategy enabled us to use all available outcome data for all participants with at least one outcome measure, therefore minimising the chance that this has affected our results. Our sensitivity analysis indicated that our results were not affected by selection bias. However, for outcomes with only two measurements, changes in inequalities over childhood should be interpreted with caution and require replication in other studies. Our conclusions are limited by the fact that we do not have early measurements on all outcomes, and also do not have outcome measures beyond adolescence and so we cannot see how these socioeconomic inequalities in childhood go on to influence inequalities in adulthood; as the ALSPAC participants move into adulthood we will be able to explore this. Our sample was predominantly of white European origin. We are thus unable to examine ethnic inequalities in health, and our findings may not generalise to those from other ethnic backgrounds. The nature of socioeconomic inequalities and how they change over childhood may be context specific, differing between countries and generations; the main study demonstrating widening of health inequalities across childhood was conducted in the USA,6 whereas another study that did not find evidence of widening socioeconomic inequalities over childhood used data from the UK.10 Thus, the generalisability of our findings needs to be assessed by replicating the research in other cohorts. We have assessed inequalities on the mean difference scale, that is, absolute inequalities; examining relative differences (ratios) can sometimes produce different patterns,32 so our result cannot be extrapolated to draw conclusions about relative inequalities. The relationships between maternal education and child/adolescent outcomes observed in this analysis will be mediated through many different pathways, for example, parental health, environmental exposures, quality of schooling, parenting techniques; exploration of these mediating pathways would provide insight into the socioeconomic inequalities and potential interventions that could alleviate them, but this is beyond the scope of the current analysis.
Conclusion and implications
We sought to compare socioeconomic inequalities in outcomes across multiple domains of childhood as precursors to possible inequalities in adult health. We observed socioeconomic inequalities in a range of health, behavioural and educational outcomes in childhood. Associations were strongest for educational and behavioural outcomes and considerably weaker for health indicators. Up to age 15 years we found no strong evidence that inequalities increased with increasing age across childhood. Thus, while childhood socioeconomic inequalities in health and health-related characteristics might be important determinants of adult health inequalities, our results suggest that such inequalities are established in early childhood but do not increase markedly up to adolescence.
What is already known on this subject
-
Low socioeconomic status is associated with worse child health, behaviour and educational attainment.
-
Some studies suggest that socioeconomic inequalities in health widen as children get older.
-
Studies to date have not taken a unified approach to examine how socioeconomic inequalities in multiple domains of childhood (health, behaviour and educational attainment) change with age.
What this study adds
-
Our results suggest that health, behavioural and educational inequalities are established in childhood but do not increase up to adolescence.
-
Inequalities in behaviour and education were considerably larger than in health measures.
References
Supplementary materials
Supplementary Data
This web only file has been produced by the BMJ Publishing Group from an electronic file supplied by the author(s) and has not been edited for content.
Files in this Data Supplement:
- Data supplement 1 - Online supplement
Footnotes
-
Contributors The study was designed by CP and LDH. LDH, DAL and CP designed the analysis strategy. LDH carried out statistical analysis and wrote the first draft of the manuscript. DAL and CP made critical edits and revisions to the manuscript, and all authors read and approved the final version of the manuscript.
-
Funding This work was supported by a grant from the UK Economic and Social Research Council (RES-060-23-0011), which paid the salary for LDH. The UK Medical Research Council (MRC), the Wellcome Trust and the University of Bristol provide core funding support for ALSPAC. The UK MRC (G0600705) and the University of Bristol provide core funding for the MRC Centre of Causal Analyses in Translational Epidemiology. The views expressed in this paper are those of the authors and not necessarily those of any funding body or others whose support is acknowledged. The funders had no role in study design, data collection and analysis, decision to publish, or preparation of the manuscript.
-
Competing interests None.
-
Ethics approval ALSPAC law and ethics committee.
-
Provenance and peer review Not commissioned; externally peer reviewed.
-
Data sharing statement The data access policy for the ALSPAC cohort is published on its website: http://www.bristol.ac.uk/alspac
-
Open Access This is an Open Access article distributed in accordance with the Creative Commons Attribution Non Commercial (CC BY-NC 3.0) license, which permits others to distribute, remix, adapt, build upon this work non-commercially, and license their derivative works on different terms, provided the original work is properly cited and the use is non-commercial. See: http://creativecommons.org/licenses/by-nc/3.0/