Article Text

Abstract
Background Socioeconomic mortality differences have increased in many high-income countries in recent decades mainly because of slower mortality decline among the lower social groups. The aim of this study was to investigate whether the changing socio-demographic composition explains the increasing disparity in mortality by income and the stagnation of mortality in the lowest income group.
Methods The register data comprised a nationally representative 11% sample of individuals aged 35–64 years residing in Finland in 1988–2007, linked with mortality records. Household taxable income was used as the income measure. Poisson regression models were used to assess the changes in mortality disparity among the income quintiles between periods 1988–1991, 1996–1999 and 2004–2007. The measures of socio-demographic composition included educational level, social class, employment status and living alone.
Results The mortality rate ratio (with the highest quintile as the reference category) of the lowest quintile increased from 2.80 to 5.16 among the men and from 2.17 to 4.23 among the women between 1988–1991 and 2004–2007. Controlling for other socio-demographic variables strongly attenuated the differences, but the rate ratio of the lowest quintile still increased from 1.32 to 1.73 among the men and from 1.13 to 1.66 among the women. There was no decline in the fully adjusted mortality of the lowest quintiles between second and third study periods.
Conclusions Socio-demographic characteristics explained much of the mortality disparity between income quintiles within each study period. However, these characteristics do not explain the increasing disparity between the periods and stagnating mortality in the lowest quintile.
- Mortality
- inequalities
- poverty
- record linkage
- social inequalities
- demography
- ageing
- registers
- marital status
- health behaviour
- social epidemiology
- occupational health
- sickness absence
Statistics from Altmetric.com
- Mortality
- inequalities
- poverty
- record linkage
- social inequalities
- demography
- ageing
- registers
- marital status
- health behaviour
- social epidemiology
- occupational health
- sickness absence
Introduction
Various studies report an inverse association between individual-level income and mortality.1 ,2 The association is complex, and differences in income measures, study periods and populations and national welfare systems affect its nature and strength3 ,4 Both curvilinear and linear income–mortality relationships have been reported after adjusting for various socio-demographic factors in Finland2 ,3 ,5 and elsewhere.1 ,6 ,7 However, there is little information on the possible changes in the associations over time. Relevant studies focus on one period only, although there is some evidence of differing association between income and mortality between time periods in Finland.3 ,5 It has also been reported that the association between income and mortality strengthened slightly among the working-aged population in New Zealand between 1981 and 1999.6
It was found in a recent study investigating trends in life expectancy among income groups in Finland that the disparity between the lowest and the other income quintiles had increased over the previous 20 years as a result of stagnation of life expectancy in the lowest quintile. The increase in this disparity originated particularly among the 35–64-year-old population.8 The causes of these changes are uncertain but may relate to adverse compositional change in the poorest groups. The distribution of characteristics known to be related to an increased mortality risk, such as living in a single household and being unemployed or out of the workforce,9 ,10 may change between income groups over time. The recession of the early 1990s hit Finland hard, with unemployment increasing from roughly 3% of the late 1980s to 16%–18% in 1993–1996.11 Also the proportion of single households has increased from 30% to 40% in 1988–2007.12 Given this development, it is plausible to suggest that the proportions of the unemployed, people out of the workforce and single households may have increased more in the lowest income quintile than in the general population. Therefore, it is necessary to assess whether the observed change in the composition of the income quintiles is related to the increasing mortality disparity.
The aims of this study were twofold: first, to estimate whether the changes in the socio-demographic characteristics of the income groups explain the changing mortality disparity of income groups from 1988 to 2007 and second to investigate whether the compositional change explains the stagnation of mortality in the lowest income quintile. We concentrated on the 35–64-year-old population, given evidence that the increasing mortality disparity between socioeconomic groups in Finland13 and elsewhere1 stems to an important extent from the working-aged population.
Data and methods
The data set used is a nationally representative 11% random sample of all persons residing in Finland in at least one of the years between 1988 and 2007. Statistics Finland linked data on socioeconomic and demographic characteristics from various registers with death records using personal identification codes (permission TK-53-1783-96). The power of the analyses was increased by including 80% of all the persons who died during the follow-up period to the study population. Sampling weights for each individual were constructed from the known sampling probabilities in order to take into account the sampling design. The study period was divided into three 4-year periods: 1988–1991, 1996–1999 and 2004–2007. We focused on all individuals who were between the ages of 35 and 64 at any time during each of these periods. Those reaching the age 65 were censored at that age, and those reaching the age of 35 during the follow-up period were followed from then onwards. Institutionalised persons were censored for the years spent in institutions, and emigrants (altogether <0.5% of the total population) were censored at the end of the emigration year. The final dataset comprised 92 768 deaths during the three study periods.
The information on income was obtained from the registers of the Finnish Tax Administration and the Social Insurance Institution. We used household taxable income as our income measure, which consists of wages, capital income and taxable income transfers of all household members. Taxable income excludes some non-taxable transfers such as child benefits and certain housing allowances. These non-taxable transfers and paid taxes were taken into account in the measure of disposable household income. This measure was used in the sensitivity analyses as it was available only for the period 1996–2007. We took into account the household composition by dividing its income by the total number of consumption units in the household: the first member over the age of 17 corresponded to one unit, all others over that age to 0.7 units and children younger than 18 to 0.5 units.5 ,14 We calculated cut-off points for the income quintiles separately for each year from data combining men and women and used income information from the year preceding the mortality follow-up. Income may be subject to reverse causation as possible deterioration in health may lead to lower income. We assessed the impact of this in sensitivity analyses using the income information from 3 years before the mortality follow-up.
The socioeconomic variables we used as covariates were educational level, occupational social class and economic activity. Education was classified as basic (ISCED-1997: 0–2), intermediate (ISCED-1997: 3–4) and high (ISCED-1997: 5–6). The five occupational social classes were upper-white-collar employees, lower-white-collar employees, manual workers, self-employed and others. Economic activity at the end of the year was classified into six groups: employed, unemployed, retired, on a disability pension, student and others. Living alone was assessed by means of a dichotomous variable classified as persons living in single households and those living with others. All these covariates were measured yearly, except for occupational social class, which was measured in 5-year intervals.
Directly standardised death rates were calculated using the total male and female population aged 35–64 years in 1988–2007 as the standard population. STATA V.10.1 software was used to estimate the Poisson regression models for ungrouped data for the three study periods, with income as a time-varying covariate. The results of the regression models are reported as mortality rate ratios (RRs). The covariates were added in their presumed causal order to assess their impact on the mortality differences. Model 1 included age and income, and model 2 incorporated the educational level and occupational social class. Given that economic activity is closely related to both mortality and income,1 it was added to the model separately from the other socioeconomic variables (model 3). Living alone was adjusted for as the last variable (model 4) because its effect is partially included when the income measure is divided by the number of consumption units. The proportion of excess mortality explained by the socio-demographic variables was calculated as ((RR in Model 4 − RR in Model 1))/((RR in Model 1) −1) ×100. Interactions of study period and income quintile were plotted in order to assess the change in the shape of the relationship between income and mortality, thereby allowing for changes in the level of mortality over time.
Results
Tables 1 and 2 show the directly age-standardised mortality rates and the number of deaths during the three study periods. Mortality rates decreased in the four highest quintiles, especially from 1988–1991 to 1996–1999 but also from 1996–1999 to 2004–2007. In the lowest income quintile, mortality decreased slightly between the first and second periods but then increased during the last period. The proportion of the unemployed increased substantially from the first to the second period in the two lowest quintiles and then decreased in every quintile. However, the proportion of persons outside the labour force decreased from the first to the second period in the lowest quintile but slightly increased towards the last period against a decrease in the other quintiles. The percentage of persons living alone increased more rapidly in the lowest quintile than in the other quintiles.
Age-standardised death rates (per 10 000 person-years), number of deaths and proportions of key demographic characteristics by income quintile, 35–64-year-old men in 1988–2007
Age-standardised death rates (per 10 000 person-years), number of deaths and proportions of key demographic characteristics by income quintile, 35–64-year-old women in 1988–2007
Among the men, the age-adjusted mortality ratio between the lowest and the highest quintiles increased from 2.80 in the first period to 5.16 in the last period (table 3). Most of the association was attenuated when economic activity was controlled for, but controlling for education, social class and living alone also attenuated it slightly. Altogether, the control variables explained roughly 80% of the excess mortality in the lowest income quintile and slightly less in the second and third quintiles in the last observation period. The attenuation was mainly attributable to economic activity. Nevertheless, the fully adjusted mortality ratio (model 4) of the lowest quintile increased from 1.32 to 1.73 from the first to the last period. This increase in relative excess mortality of the lowest quintile was almost equal as in the age-adjusted model (4.16/1.80=2.31 vs 0.73/0.32=2.28).
Mortality ratios of all-cause mortality for income quintiles adjusted for age, education, socioeconomic status, economic activity and living alone in 1988–1991, 1996–1999 and 2004–2007, men aged 35–64 years
Among the women, the age-adjusted mortality ratio increased from 2.17 to 4.23 between the first and the third periods (table 4). Almost all of the excess mortality was explained by the adjustments during the first and second periods, except in the lowest quintile. In the last period, the proportion of excess mortality explained by the adjusted factors decreased substantially in second to forth quintiles and <80% of the excess mortality was explained, mostly on account of controlling for economic activity. Despite the adjustments, the excess mortality of the lowest income quintile increased from 1.13 to 1.66 from the first to the last period. The relative increase in excess mortality of the lowest quintile is even greater than in the age-adjusted model.
Mortality ratios of all-cause mortality for income quintiles adjusted for age, education, socioeconomic status, economic activity and living alone in 1988–1991, 1996–1999 and 2004–2007, women aged 35–64 years
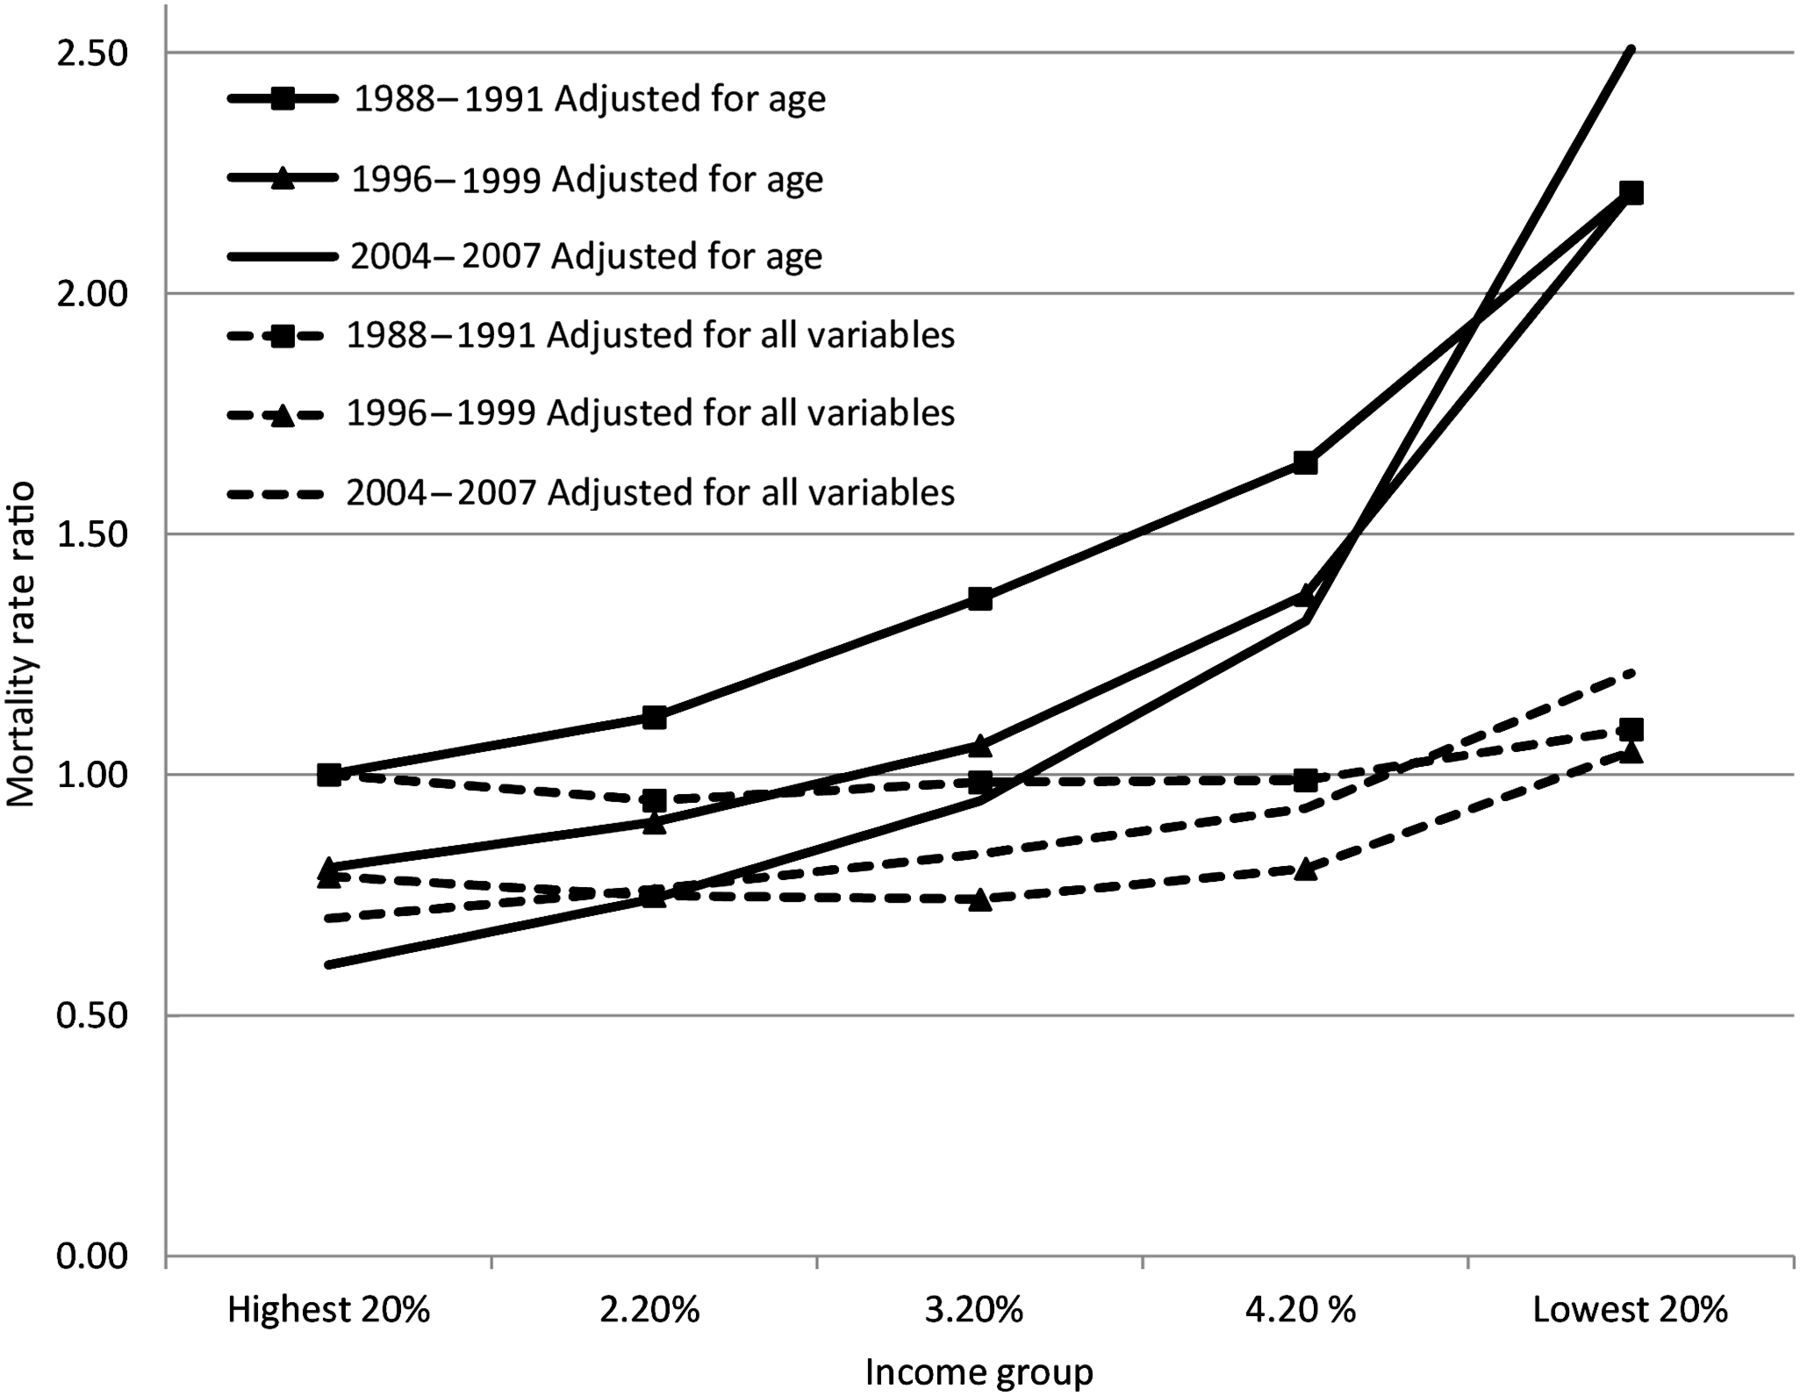
Figures 1 and 2 trace the interaction between income and the study period, thereby showing the changes in mortality level among the income groups. Mortality in the highest quintile in 1988–1991 was used as the reference category. The figures show that the relationship between age-adjusted mortality and income was clearly more curvilinear in 2004–2007 than during the previous periods among both men and women. This is attributable to the fact that mortality decreased in the four highest quintiles across all periods but stagnated among the men in the lowest quintile and even increased among women in the lowest quintile.
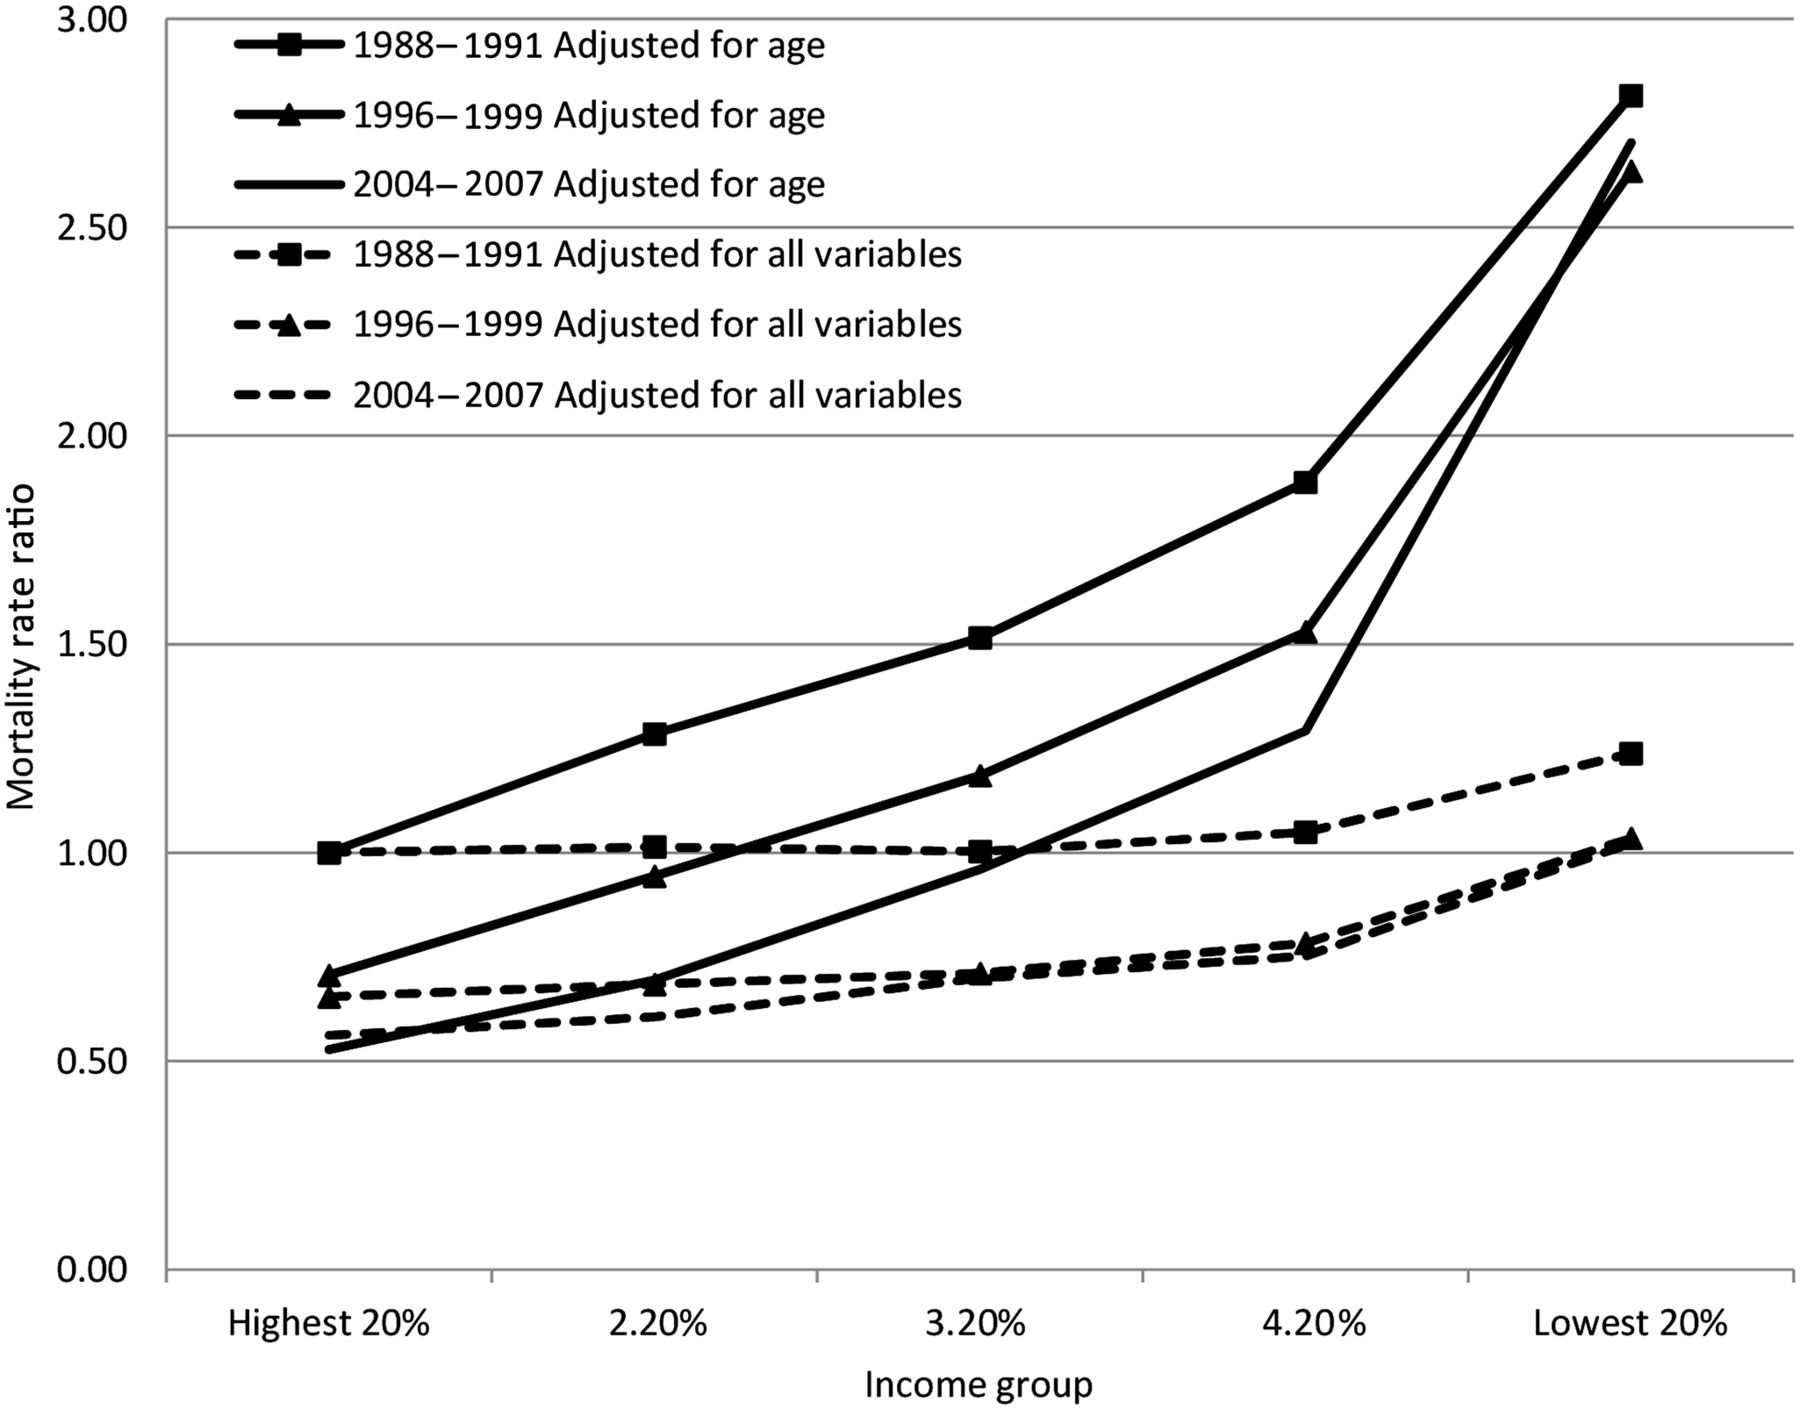
Relative mortality of income quintiles by time periods, adjusted for age and all explanatory variables (highest quintile in 1988–1991 as reference category), men.

Relative mortality of income quintiles by time periods, adjusted for age and all explanatory variables (highest quintile in 1988–1991 as reference category), women.
Following adjustment for all socio-demographic variables, it is clear that virtually all the decrease in mortality among men occurred between 1988–1992 and 1996–1999. There was stagnation in the three lowest quintiles between the last two periods and a continuing slight decline in the two highest quintiles among men. Among the women, there was a slight decrease in fully adjusted mortality between the first two periods in the four highest quintiles, after which it stagnated in the two highest quintiles. Mortality increased in the three lowest quintiles, ending up in the lowest quintile on a higher level than in the first period.
Discussion
Principal findings
This study produced two main findings. First, the relative disparity in age-adjusted mortality between the income quintiles increased over time. Controlling for the explanatory variables, particularly economic activity, strongly attenuated the mortality differences, but the increasing disparity remained.
Second, age-adjusted mortality stagnated among the men in the lowest quintile from 1996–1999 to 2004–2007 and even increased among the low-income women. Therefore, the curvilinear nature of the relationship between income and age-adjusted mortality strengthened over time. Following adjustment for socio-demographic composition, mortality decreased in all income quintiles between 1988–1991 and 1996–1999, but during the third period of 2004–2007, it stagnated among the men and increased among the women in all three lowest income quintiles. The shape of the relationship between income and mortality after the adjustments was increasingly linear towards the last period among both men and women.
Strengths and weaknesses
The register data used in the study provide reliable measurement in a large sample that has virtually no loss to follow-up. Problems attributable to self-reported income, the varying definitions of income and the non-linkage of questionnaire data with death certificates are avoided. Income may be sensitive to reverse causality among those of working age, but our measure of household income is less sensitive to changes in labour force participation—a variable we adjust for in our regression models—than individual income. We further assessed the impact of health-related reverse causality on the results in sensitivity analyses using either taxable income from 3 years before the mortality follow-up or disposable household income. These analyses re-confirmed the increasing income-related disparity in mortality from 1996–1999 to 2004–2007. This and the stagnation of mortality level in the lowest income quintile remained after the adjustments, but the excess mortality in the lowest income quintile was smaller than when income was measured using taxable income from the preceding year. We also conducted the initial analysis for the periods of 1992–1995 and 2000–2003. No divergence from the general trend was observed during these periods and therefore the analysis including five periods is presented as appendix tables 1 and 2 only in the online version of the article.
Comparison with previous studies
The strengthening association between income and age-adjusted mortality is in accordance with previous findings from Finland8 ,15 and with evidence from various high-income countries of increasing differentials in mortality based on other socioeconomic status measures.16–18 Although the relationship between income and age-adjusted mortality is clear, controlling for economic activity appears to weaken the association substantially.1 ,2
Two studies, one focusing on the period 1985–19943 and the other on 1998–2004,5 give indications of a possible increase in the association between low income and mortality in Finland, even following adjustment of some confounding variables. The results of these two studies imply that income differentials in mortality have increased. Using consistent income measurement over time, we were able to confirm that the disparity in mortality between household income quintiles has indeed increased and to quantify this increase as very large and observable both before and after controlling for socioeconomic characteristics and economic activity.
There appears to be only one previous study with explicit information on temporal changes in the income–mortality relationship and including adjustment for socio-demographic characteristics.6 The study, conducted in New Zealand, reports no changes in the shape of the association, only a strengthening relationship between income and age-adjusted mortality towards the late 1990s. However, unlike in our study, this originated in the changing socio-demographic composition of income groups in that adjusting for economic activity explained the increasing disparity completely. Moreover, roughly 30% of deaths could not be linked to the census data and the population distribution among the income groups changed over the study period.
Previous Finnish studies report a curvilinear relationship between income and mortality—although the degree varies—using household income before and after making similar socioeconomic adjustments as in this study.3 ,5 In the light of our results, it seems that the age-adjusted income–mortality relationship is becoming increasingly curvilinear among both men and women, whereas the increasing curvature disappears following adjustment for various socio-demographic covariates. This variability indicates that it is not only measurement of income,4 ,5 cause of death,2 ,7 geographical location and the model adjustments but the exact shape and curvilinearity of the relationship is also sensitive to the study period.
Possible explanations for changes in the income–mortality association
Our results show an increase in the relative excess mortality among the lowest income groups over time, which cannot be attributed to the changing socio-demographic composition. It is difficult to verify the reasons for such development, but it is possible to identify some general mechanisms. First, the various selective socioeconomic characteristics that are detrimental to health may have become more prevalent in the lowest income group or their effects on mortality may have strengthened over time. Second, the harmful causal effects of having a low income may have increased.
The changes in the mortality level among the income quintiles and the stagnation reported in the lowest quintile may also be related to the aforementioned mechanisms. In our data, the overall decrease in mortality level between the last two periods was largely attributable to advantageous socio-demographic compositional change in the income quintiles, thereby implying that the reduction in age-adjusted mortality in the four highest quintiles was mostly attributable to changes in the socio-demographic composition of the income groups. However, the high proportion of unemployed and the increasing proportion of persons outside the labour force do not explain the stagnation or increase in mortality in the lowest income quintile between the last two periods. It may even be that the decrease in the unemployment rate after the recession of the early 1990s led to those with poor health being concentrated even more in the lowest income quintile as re-employment is likely to be selective in terms of health status.19
The adverse temporal development in the lowest income quintile coincides with the post-recession restructuring of the economy and welfare-state policies, characterised by increasing social polarisation since the late 1980s as a result of increasing job insecurity, long-term unemployment and social exclusion.20 On the other hand, the unemployment compensation system did relieve the impact of high unemployment on the income inequality to some extent during early 1990s.21 It is likely that many of these changes had a stronger effect on those with less education and the lowest socioeconomic status. Furthermore, recovery from the recession was selective in that much of the economic growth originated in sectors requiring high qualifications.22 The number of people excluded from the labour market and dependent on social security benefits has increased since the early 1990s.23 However, changes in the social class and education distributions did not explain the stagnation in mortality we found in the lowest income quintile, but they did explain some of the relative mortality disparity during each of the study periods.
Both the stagnating or increasing mortality in the lowest income quintile and the increasing relative mortality disparity remained even following adjustment for socio-demographic composition, indicating a possible increase in the harmful effects of being on a low income. The real disposable income after housing costs in households dependent on social support (excluding persons on pensions) decreased or remained the same from 1990 to 2010.23 This may have affected the independent effect of income on mortality in that those dependent on social support may experience increased material hardship. Furthermore, changes such as increased patient fees in the healthcare services during the 1990s may well have limited the possibilities of seeking medical treatment among those on the lowest incomes,24 although there is no direct evidence supporting such claims.
Given the decreasing explanatory power of socio-demographic composition with regard to income differences in mortality, the question arises whether there are other emerging risk factors explaining the relationship between income and mortality that remain unobserved. It is possible that unmeasured factors such as personality, adverse life-events earlier on and health behaviours explain some of the increase in the association. Some evidence of growing importance of smoking to the educational mortality disparity among women has been reported in Finland.25 There are also unobserved factors (eg, improved treatments) which decrease the level of mortality overall and make the contribution of socio-demographic composition to stagnating mortality more difficult to interpret. On the other hand, factors such as education can become increasingly protective against mortality if unobserved factors are increasingly related to educational level.
In earlier decades, a large proportion of the mortality disparity in Finland stemmed from differences in mortality to cardiovascular diseases, but following the dramatic decrease in cardiovascular disease-related deaths, cancer has become more significant in increasing the mortality disparity.15 ,26 Furthermore, an increasing proportion of the disparity and the stagnation in the lowest income quintile is driven by mortality to alcohol-related causes.8 ,15 Therefore, cause-of-death-specific analyses are needed in order to determine to what extent the change in the income–mortality relationship after all the adjustments originates from specific causes.
Conclusions
Our results show that the association between income and mortality has strengthened in the past 20 years. Both the increasing proportion of adverse socio-demographic characteristics in the lowest income quintile and the increasingly harmful effects of having a low income are likely to be behind the increasing disparity. Those on low incomes are becoming clearly differentiated from other quintiles in terms of mortality.
What is already known on this subject
-
The relationship between income and mortality is widely studied, but the temporal perspective on the issue is little covered. This article provides insight to the change in the strength and nature of the relationship and assesses the significance of socio-demographic compositional characteristics in explaining the changes in income–mortality disparity in the context of Finland.
What this study adds
-
The association between income and mortality has strengthened in the past 20 years. Both the increasing proportion of adverse socio-demographic characteristics in the lowest income quintile and the increasingly harmful effects of having a low income are likely to be behind the increasing disparity. The exact shape and curvilinearity of the relationship is also sensitive to the study period.
References
Supplementary materials
Supplementary Data
This web only file has been produced by the BMJ Publishing Group from an electronic file supplied by the author(s) and has not been edited for content.
Files in this Data Supplement:
- Data supplement 1 - Online Appendix
Footnotes
-
Funding This work was supported by the Academy of Finland.
-
Competing interests None.
-
Ethics approval Statistics Finland Ethical Committee approved the mortality records linkage (permission TK-53-1783-96).
-
Provenance and peer review Not commissioned; externally peer reviewed.