Article Text

Abstract
Background Middle-aged and older American men and women have almost twice the rate of diabetes of men and women in England. This differential was not explained by conventional risk factors including age, smoking, social position and body mass index (BMI).
Methods This study used large and representative samples of non-minority adults aged 52–85 years taken from the 1999–2006 American National Health and Nutrition Examination Survey (NHANES) and the 2004 English Longitudinal Study of Aging. The surveys contain self-reported and objective biological disease markers of diabetes as well as indicators of major risk factors for diabetes including anthropometric measures of BMI, height and waist circumference.
Results The older American population has much higher rates of diabetes than the English population—a differential not yet explained, but this population also has higher waist circumference at each level of BMI than does the equivalent group in England. By controlling for such waist circumference differences and allowing for different effects of waist on diabetes in each country, approximately three-quarters of the country differences for women and 38% among men can be explained.
Conclusions Higher rates of diabetes in the US old-age population than in England were largely accounted for by raised waist circumference and not BMI differences, especially among women. In addition, elevated diabetes risk associated with higher waist circumference in the USA as opposed to England could arise as a result of a number of different mechanisms. Investigation of the relative importance of such mechanisms is an important topic for further study.
- Body mass index
- diabetes
- international health
- obesity
Statistics from Altmetric.com
Diabetes prevalence is approximately twice as high in the USA compared with England for both sexes.1 This difference was not due to differential disease self-reporting by country because the differential exists using either self-reports of doctor diagnosis or objective markers of diabetes. Conventional models of diabetes prevalence that included standard risk factors (smoking, age, social position) indicated that little of this international difference was explained by country differences in these risks.1 These differences remained substantial when body mass index (BMI) indicators of overweight or obese were included in the analyses, indicating that other factors were responsible.1
Recent data suggested that other aspects of body shape including waist circumference were different across countries.2 Increasing waist circumference was associated with the increasing risk of subsequent diabetes and was more predictive than BMI.3 4 The association of increased diabetes or its risk factors with shorter height has been described in many populations.5 6
Earlier analyses examining international differences in diabetes did not examine the role of waist circumference.1 We study its importance in the English Longitudinal Study of Ageing (ELSA) and the American National Health and Nutrition Examination Survey (NHANES), which are nationally representative cohorts with both BMI and waist circumference measurements. Our aim was to expand these models to consider the simultaneous risks of both BMI and waist circumference, and to assess how much of the difference in diabetes prevalence between England and America was explained by these body shape risks.
Methods
Data
We used data from eight waves of NHANES, fielded between 1999 and 2006,7 and the 2004 second wave of ELSA. We combined NHANES waves from before and after ELSA 2004 to have comparable sample sizes. There was no statistically significant trend in diabetes prevalence over NHANES years 1999–2006 so NHANES was time comparable with ELSA. NHANES included data obtained through personal interviews, physical and laboratory examinations for people 2 months and older. For age comparability, we restricted our NHANES sample to respondents between 52 and 85 years old—age 52 years was the minimum age in ELSA and age 85 years was the maximum age in NHANES. To ensure that country differences were not due to high rates of diabetes among African-Americans or Hispanic individuals in America or Asian and black immigrants in England, our analysis was restricted to non-Hispanic white individuals. There were 4570 non-Hispanic white NHANES respondents in this age range.
ELSA contained respondents recruited from three separate years of the Health Survey for England providing representative English samples aged 50 years and over in 2002. Health data were supplemented by the collection of social and economic data.8 ELSA protocols included interview visits followed by nurse visits when saliva and blood samples were drawn. Blood samples were analysed for glycosylated haemoglobin, also available in NHANES. There were 6888 respondents in our ELSA analytical sample.
NHANES is a nationally representative survey of Americans less than 85 years of age with a high response rate. The baseline response rate in 2005–6 was 80% and 77% for those receiving medical examinations. Its sample characteristics closely match the current population surveys. NHANES is a repeated cross-sectional survey so it was unaffected by sample attrition (see http://www.cdc.gov/nchs/nhanes/response_rates_CPS_.htm).
We examined impacts of differential response bias and sample attrition in ELSA on estimates of disease prevalence including diabetes by comparing estimates with those from the Health Survey for England.9 Differences in diabetes prevalence between the two countries were equally large in cross-sectional national surveys indicating that disease prevalence rates were not significantly biased due to differential attrition or response rates.
Measures of diabetes prevalence
Both surveys collected data on individual diabetes self-reports of the form ‘Did a doctor ever tell you that you had diabetes…’ as well as glycosylated haemoglobin (HbA1c), a measure of the percentage of haemoglobin molecules bound to glucose. Although not usually a screener for diabetes, HbA1c is highly correlated with fasting plasma glucose levels.9 10 While there is no strict diagnosis threshold value, we took values greater than or equal to 6.5% as indicating clinical diabetes (an international threshold recently approved).11 Our results were insensitive to the specific thresholds chosen. Respondents were classified as having diabetes if either they answered affirmatively to the self-reported diabetes question or their HbA1c levels were 6.5% or greater. Our measures were thus unaffected by country differences in undiagnosed diabetes.
Measures of BMI and waist risk
Height and weight measurements were taken during nurse-conducted physical examinations so objective BMI measures were computed free of errors in self-reports.12 We experimented with two BMI measures—categorical indicators of whether respondents were obese (BMI ≥30) or overweight (BMI ≥25 and <30) and continuous BMI measures (kg/m2) entered as quadratics. As height may have an independent effect,13 height in metres was entered as a quadratic.
BMI provides a crude index of adiposity by not considering central fat mass, which is more strongly associated with disease risk. Our data contained both BMI and central fat mass—objectively measured waist circumference in centimetres.14 Similar to BMI, we experimented with two measures of waist risk. The first categorised respondents into three waist risk groups (low, medium and high) in which centimetre cut-off points differed by gender.15 16 The male groups were low (<94 cm), moderate (94–101 cm) and high risk (≥102 cm), whereas for women cut-off points were low (<80 cm), moderate (80–88 cm) and high risk (≥88 cm). Our second measure was waist in centimetres, entered as a quadratic.
Other risk factors
American education was separated into high school or less (0–12 years), more than high school but not a college graduate (13–15 years) and college or more (16 years or greater). The English three-way education division was qualified to a level lower than ‘O’ level or equivalent (typically 0–11 years), qualified to a level lower than ‘A’ level or equivalent (typically 12–13 years of schooling), and a higher qualification (more than 13 years). Our surveys collected several health-related behaviours including smoking status (ever smoked) and marital status (single or married).
Statistical methods
We estimated six models of diabetes prevalence separately for men and women. We began with a baseline model pooled across countries with no covariates except an indicator of country—our ‘unadjusted’ model or country differences in diabetes prevalence we tried to explain. The subsequent five models labelled 1 to 5 all included quadratics in age and in height, and indicator variables described above for education, marital status and smoking.
We were particularly interested in the role of BMI and waist circumference combined with how they were measured. Models 1 to 5 differed in how we specified them. Model 1 used conventional BMI categorical indicators of obesity and overweight; model 2 had the same BMI categorical indicators and added waist categorical indicators of moderate and high waist risk; model 3 had continuous BMI entered as a quadratic; model 4 had continuous BMI and continuous waist both as quadratics; model 5 had the same model as model 4 but in addition allowed the effects of continuous BMI and continuous waist to differ between America and England.
We relied on ordinary least squares regression models of prevalence, estimated using Stata statistical software. As our models contained interaction terms, logistic regressions do not provide a straightforward interpretation.17 Nevertheless our conclusions from the non-interactive models were unchanged if multiple logistic or multivariate probit models were used.
Results
Table 1 lists means and standard deviations of variables and displays results of statistical tests for country differences. American male prevalence was 16% compared with 11% for English men and 14% for American women compared with 7% for English women. Both country differences in diabetes prevalence were statistically significant at the 1% level.
Means and standard deviations
Conventional diabetes risk factors were similar in the American and English populations examined. On average Americans are only a little taller, have slightly higher BMI and are approximately 3 years older. The English were less educated and more likely to have smoked, risk factors that normally increase diabetes.3 18 19 The only attribute offering some explanatory promise was waist circumference. American men have almost 3 cm larger waists than English men, and the waists of American women are 5 cm bigger than English women (p<0.01).
Figures 1–3 present age standardised distribution of waist risk (low, moderate and high) among those whose BMI is below 25, between 25 and 30 and 30 and over separately by gender in both countries. Age standardisation eliminated impacts of country differences in age distributions. Using age groups 50–59, 60–69, 70–79, 80 years and over, age-weighted BMI and waist risks were calculated. To capture risk variation, individuals were placed into three BMI groups and three waist risk groups defined above. Supplementary appendix table A, available online only, includes statistical tests of differences in waist and BMI between countries.

Distribution of waist risk for those with BMI below 25.

Distribution of waist risk for those with BMI between 25 and 30.
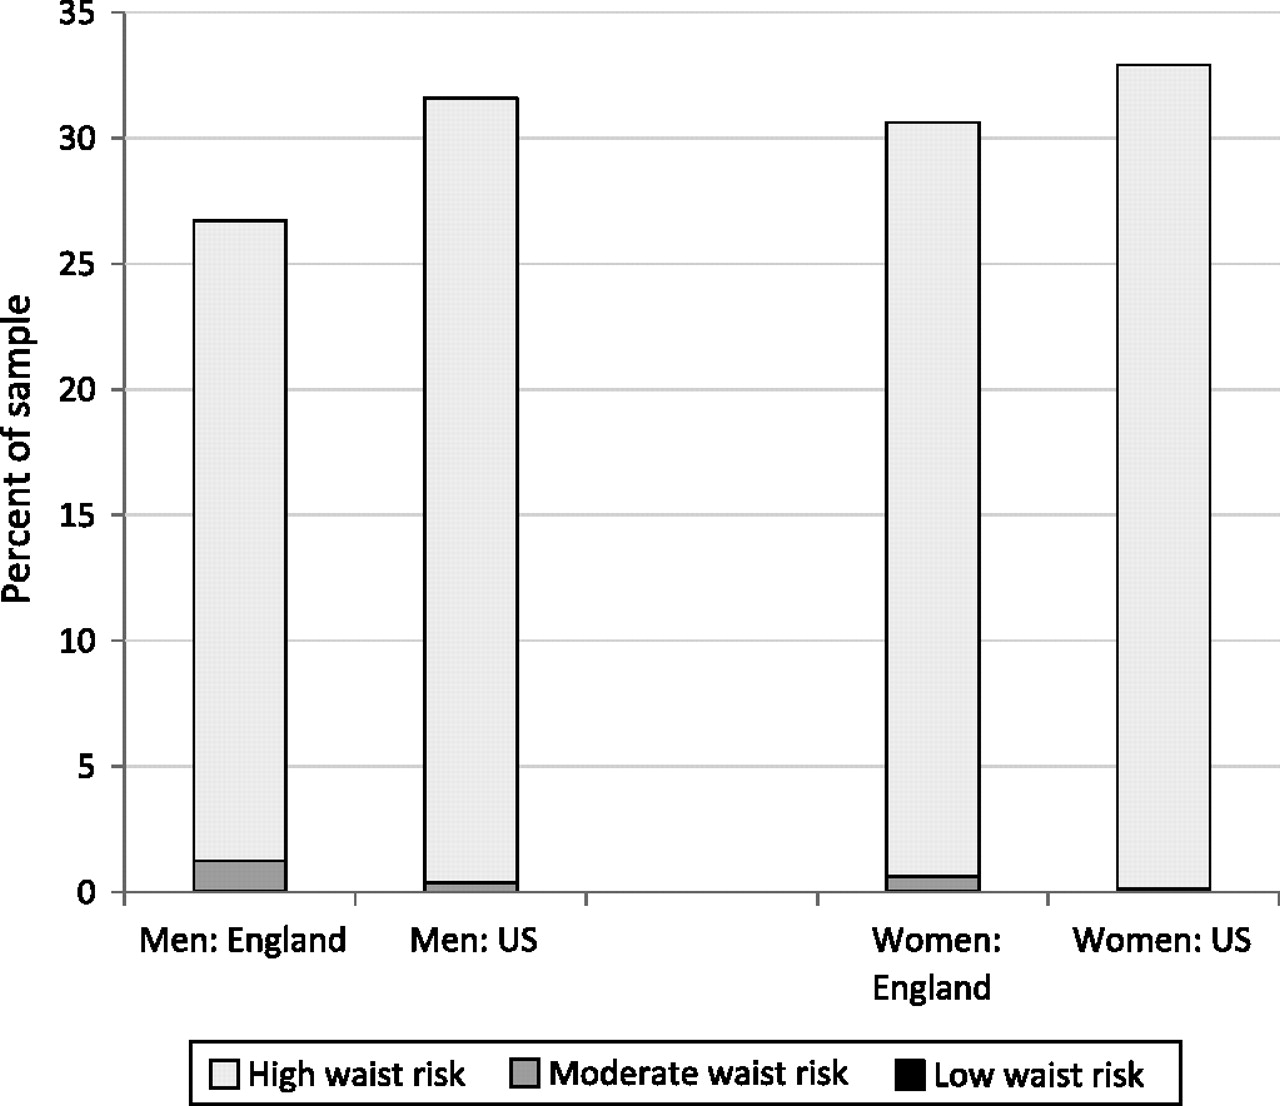
Distribution of waist risk for those with BMI 30 or over.
American men were more obese than English men (31.6% compared with 26.7%) but less overweight (44.0% compared with 48.3%) with no difference in normal weight. Female obesity differences were even smaller (32.9% of Americans compared with 30.6% among English women), a disparity not statistically significant and not large enough to explain a two-to-one diabetes prevalence differential between countries. Compared with English women, American women were less overweight (32.1% compared with 38.7%) and more of normal weight (35.0% compared with 30.8%). Given these BMI distributions, it is unsurprising that BMI alone cannot explain higher diabetes rates among Americans.
Marginal distributions of waist risk within each BMI group were more to the disadvantage of American men than BMI differences and female disparities are striking—56.0% of English women have high waist risk, whereas the comparable fraction among Americans was 69.4%—a statistically significant difference. These differences are in accord with recent evidence from smaller more specialist studies in which body shape was measured using three-dimensional body scanning equipment in both countries.
If there was a one-to-one correspondence between BMI and waist risk categories, there would be little reason to prefer one. But this is not true. Among the overweight in figure 2, 56% of American men have high waist risk compared with 41% of English men, while 87% of American women have high waist risk compared with 61% of English women. Even among those with normal weight, the fraction with raised waist risk was not trivial for US women—40.6% of Americans who were neither overweight nor obese were categorised as high waist risk compared with 8.9% among equivalent English women. The only BMI category with little additional information obtained from waist were the obese (figure 3). At least 95% of respondents labelled obese were simultaneously labelled high waist risk.
Figure 4 summarises the ability of factors to explain country differences in diabetes prevalence using our six models. For each model, the solid bar indicates our estimate of ‘unexplained’ prevalence rate differences between America and England, while the lines represent 95% CI around that estimate. The unadjusted specification reported a baseline model pooled across countries with just the country dummy (=1 indicates US). This model highlighted unadjusted country differences in diabetes—4.8% for men and 7.3% for women.

Estimated diabetes prevalence difference between US and England.
Subsequent models in the next five rows in figure 4 sequentially expand the set of covariates while maintaining the assumption that the effects of covariates are the same in both countries. All models below unadjusted included quadratic controls for age and height, indicator variables for education groups, single and smoking. Models 1–4 varied the way in which BMI and waist circumference were included in models.
Model 1 estimates in figure 4 represented the traditional approach to measuring BMI—two indicators for whether one was overweight or obese. This model did not explain any between-country prevalence difference—some factors (age, BMI) predict higher US diabetes prevalence, other factors (education, height) predict the opposite with combined effects largely offsetting. Model 2 highlights the impacts of adding categorical variables to capture waist risk—these effects are quite modest in reducing unexplained country prevalence differences.
Model 3 was similar to model 1 except continuous quadratic BMI replaced standard obese and overweight categories controls. Estimated country prevalence differences were unchanged. Model 4 shows effects of including continuous quadratic measures of BMI and waist risk. With both shape variables measured continuously instead of as categories, we explained one quarter of the original male difference in prevalence and approximately 60% of the female difference. Continuous BMI by itself does not help explain country differences (another illustration of BMI deficiency), but a combination of continuous measures of BMI and waist significantly reduced country differences in ‘unexplained’ diabetes prevalence.
Models 1–4 did not allow effects of BMI or waist on predicting diabetes to vary by country. Our preferred model 5 allowed estimated impacts of both body shape measures to vary between countries. The remaining unexplained male country difference was 3 percentage points and 1.9 percentage points for women. As indicated by 95% CI in figure 4, female country difference in diabetes was no longer statistically significant. Control variables in this model explained 38% of country difference in male prevalence and 74% of female differences.
The regression models underlying model 5 in figure 4 are presented in table 2. Estimates for non-anthropometric variables were as expected.20 The probability of diabetes rose with age at a decreasing rate, increased height is associated with lower diabetes risk, and smoking and marital status did not matter.21 22
Models of diabetes prevalence
After controlling for waist, we found no statistically significant effect of BMI for American or English men or women. In contrast to weak BMI effects, waist risk was strongly associated with diabetes, with risk increasing in waist circumference. Based on a likelihood ratio test, quadratic waist terms were statistically significant for American men and women implying that the consequences of raised waist are higher for them compared with the English.
Discussion
We found significant roles for height and waist on diabetes prevalence. The mechanisms by which height reduces diabetes risk are unclear. Adult stature reflects childhood growth patterns and an association of short stature with type 2 diabetes indicates that impaired childhood growth leads to adult insulin resistance and diabetes.23 Mechanisms include poor nutrition in childhood.24 There may be reverse causation at older ages, in which co-morbidity with diabetes is associated with height reduction, but we found no significant age interactions indicating that these influences are unlikely to vary by country. While height was related to diabetes risk, height cannot explain country differences because average height was approximately the same in both countries.
In contrast, waist circumference explained a substantial proportion of higher diabetes in America for men and virtually all differences for women, but continuous measures were required to capture differences in diabetes risks between the two populations.
Evidence cites increasing prevalence of obesity with increased burden of disease,22 but little was explained here by obesity categorised by BMI index.1 BMI provides a crude index of adiposity by not considering central fat mass, which is more strongly associated with disease risk. Acknowledging this is important when making health comparisons across different populations. Our data suggested that in each BMI category a greater proportion of Americans were at increased disease risk and that waist circumference played the key role.
There are several potential mechanisms, including different rates of physical activity through exercise or activities of daily life, diet differences, or a more adverse psychosocial environment in America, all associated with central adiposity and type 2 diabetes.18 25 26 Adverse stressful environments may be associated with the development of central obesity.27
Evidence between central fat accumulation and diabetes risk is striking.3 4 Compared with waist hip ratio, waist circumference is a better marker of visceral fat.28 Fat cells located in the viscera display distinct cellular features compared with fat cells elsewhere, and a specific dysfunction of these cells may be the pathophysiological basis for negative consequences of abdominal obesity. Central fat cells have a higher turnover rate of triglycerides, produce more pro-inflammatory and metabolic markers than fat cells from other depots. They are involved in the mobilisation of free fatty acids into portal circulation, impaired liver function leading to insulin resistance and diabetes.
Our results were the same if we limited analyses to those whose diabetes onset occurred after age 34 years so our conclusions are not driven by country differences in type 1 diabetes. Our results thus apply most directly to type 2 diabetes.
ELSA and NHANES allowed international comparisons in large representative cohorts, a key strength of this paper, but some limitations exist. Several covariates that might influence diabetes risk were unavailable—equivalent collection of physical activity or dietary information and medication intakes. Evidence suggests that while more recently developed antihypertensive medications are not diabetogenic, older treatments increase diabetes risk.29 We cannot examine antihypertensive medication in detail, but speculate that, while physical activity and dietary intake may play a role, antihypertensive medication prescribing practices are similar in America and England and are unlikely to affect these international differences.
Two powerful conclusions follow from this research. Higher American rates of diabetes compared with England were largely due to a combination of high waist among Americans and a higher impact of waist risk among Americans. The reasons may be related to measures that were not available such as objective measures of physical activity and dietary intake.
This combination of higher waist and higher risk of high waist in America explained virtually all excess diabetes of American women and almost half for American men. BMI alone failed to explain any of these differences. Besides this key substantive conclusion, our results showed that modelling diabetes successfully requires good measures of waist risk, particularly in populations that might differ in distributions of body fat like the US and English. Similar issues should be investigated for other cardiovascular disease and countries.
What is already known on this subject
Middle-aged and older Americans have twice the rate of diabetes prevalence compared with England.
This differential is not explained by conventional risk factors including age, smoking, social position and BMI.
What this study adds
Middle-aged and older American men and particularly American women have much higher waist circumference compared with the English.
High waist circumference measured continuously was far more important than BMI in predicting diabetes prevalence.
Higher diabetes in America than in England was largely accounted for by higher American waist circumference and larger impacts of high waist on diabetes in America.
References
Footnotes
Funding Support was received from a grant from the NIA to RAND and from the NIA and the Economic and Social Research Council to the Institute for Fiscal Studies.
Competing interests None declared.
Provenance and peer review Not commissioned; externally peer reviewed.