Article Text

Abstract
Background Adult body mass index (BMI) has been consistently related to mortality, but little is known about the impact of earlier life BMI on adult mortality. The aim is to investigate the impact of childhood, adolescent and early adult BMI on premature adult all-cause mortality.
Methods The British 1946 cohort study was used to assess the association of BMI in childhood, adolescence and adulthood with mortality 26–60 years (332 deaths). 4462 (83%) respondents were available for analysis at age 26 years. Splines were used in Cox regression to model the associations between BMI and mortality.
Results In both genders, adult BMI from 20 years onwards showed a consistent U-shaped relationship with adult mortality (overall p value <0.05 for BMI at ages 20, 26 and 36 years). In women, a similar relationship was observed for adolescent BMI at 15 years (p=0.02); the HR comparing women with low BMI (2 SDs below mean) versus mean BMI was 2.96 (95% CI 1.26 to 6.97). The corresponding HR for women with BMI 2 SDs above the mean was 1.97 (0.95 to 4.10). BMI in childhood was generally not associated with adult mortality except female BMI at 4 years where a U-shaped relationship was observed (p=0.02); HR for BMI 2 SDs below mean versus mean was 2.13 (0.97 to 4.70) and the corresponding HR for 2 SDs above the mean was 1.67 (0.85 to 3.28). This association was not attenuated by subsequent BMI change or mediators.
Conclusions High and low BMI from early adulthood were related to adult premature mortality suggesting that promoting a normal weight in early adulthood could prevent premature mortality.
- Body mass index
- BMI
- growth trajectories
- life-course
- underweight
- overweight
- obesity
- childhood
- adolescent
- mortality
- longitudinal studies
- mortality SI
This is an open-access article distributed under the terms of the Creative Commons Attribution Non-commercial License, which permits use, distribution, and reproduction in any medium, provided the original work is properly cited, the use is non commercial and is otherwise in compliance with the license. See: http://creativecommons.org/licenses/by-nc/2.0/ and http://creativecommons.org/licenses/by-nc/2.0/legalcode.
Statistics from Altmetric.com
- Body mass index
- BMI
- growth trajectories
- life-course
- underweight
- overweight
- obesity
- childhood
- adolescent
- mortality
- longitudinal studies
- mortality SI
Introduction
Obesity is a major public health problem worldwide with the prevalence of obesity increasing across all age groups in many countries.1–3 Therefore, the future health consequences of childhood obesity are of great concern. However, the impact that childhood and adolescent body mass index (BMI) and obesity has on adult mortality remains unclear.4 BMI in childhood and adolescence may be associated with adult mortality as a result of tracking of BMI from childhood to adulthood, or because obesity in early life results in the early development and clustering of risk factors, in particular those for cardiovascular disease (CVD).5 To our knowledge, only three studies have investigated the relation between childhood BMI and adult all-cause mortality and the studies have produced conflicting findings.6–8 A few studies have found an association between high BMI in adolescence and increased adult all-cause mortality risk.9–14 However, most of these studies had only one measure of adolescent BMI and no measures in childhood. Many have been very large studies carried out using record linkage death registry information in Scandinavia and, therefore, lack information on adult BMI9 ,11 and other important confounders such as socioeconomic status and cigarette smoking.9–11 Two studies that were able to adjust for adult BMI produced conflicting findings: in one finding the association between adolescent BMI was independent of adult BMI in men13 and in the other the association in men was largely explained by adult BMI.12
The aim of this paper is to investigate the impact of childhood, adolescent and early adult BMI on premature adult all-cause mortality in a national British cohort with detailed prospective information on BMI throughout the life course. Further, we assessed whether any association with earlier BMI was independent of adult BMI and potential lifestyle confounders.
Methods
The Medical Research Council's National Survey of Health and Development (NSHD) is a prospective cohort of 2547 women and 2815 men—a socially stratified sample of all births that took place in England, Scotland and Wales during a week in 1946.15 Heights and weights were measured by trained personnel at ages 2, 4, 6, 7, 11, 15 and 36 years and were self-reported at ages 20 and 26 years. BMI was defined as weight/height2.
Start of mortality follow-up was taken as 1972 when cohort members were 26 years and were flagged for death on the National Health Service Central Register. By then, 2325 men and 2136 women were alive and resident in Britain and available for analysis; of the remaining cohort, 288 had already died, 586 had emigrated and 27 were excluded because they were not flagged on the Central Register. During follow-up from 26–60 years, 332 of the cohort members died (table 1). We carried out a priori power calculations to assess whether we had the required power to assess the relationship between BMI and all-cause mortality16 given the relatively small numbers of deaths. With 90% power and 5% significance we could detect a HR of 1.19 per SD increase in BMI assuming a linear relationship. We did not have the required power to assess cause-specific mortality.
Birth weight, body mass index (BMI) (kg/m2), BMI velocities and background variables
Potential confounding variables considered here have been found to have an association with mortality and weight in previous analyses of the NSHD cohort.17–19 We also considered birth weight due to its association with postnatal growth. Birth weight to the nearest quarter of a pound was extracted from medical records within a few weeks of delivery and converted into kilograms. Social class in childhood was based on father's occupation when the cohort member was aged 4 years and classified as professional/intermediate, skilled non-manual, skilled manual or partly skilled/unskilled. Highest educational qualifications obtained by age 26 years were classified as advanced level secondary qualifications, ordinary level qualifications or no qualifications. Information on smoking status was available at 20 and 25 years and so a lifetime smoking variable was created (smoker, ex-smoker and non-smoker). Those with missing information were included as separate categories for each of these three latter confounding variables.
Statistical methods
All analyses were weighted to account for the initial sampling procedure. Growth ‘velocity’ variables (change in BMI per year) were then calculated for various pre-defined periods of growth: childhood (4–7 years), pubertal (7–15 years) and post-pubertal (15–26 years). In order to facilitate the comparison of effects, BMI at each age and birth weight were standardised to have a mean of 0 and a variance of 1 separately for each sex. Cox's regression models were used to investigate the relationship between lifetime BMI and adult mortality for men and women separately. For all models, the proportional hazards assumption was checked graphically. Follow-up time was from the cohort's 26th birthday in 1972 until the first of death, emigration or the end of March 2006 (the cohort's 60th birthday). If death had not occurred, follow-up was treated as censored.
We analysed BMI using a restricted cubic spline function with five knots,20 since the associations were likely to be non-linear and in order to maximise the statistical power of the analyses. Analyses using Cole's index defining cut-off points for underweight, overweight and obesity in children21 ,22 were also performed.
The predicted log hazard rates were presented graphically with 95% confidence bands across the whole BMI range. P-values were obtained comparing the spline model to the null model using a Wald test. For comparison purposes the predicted HRs of BMI at –2, –1, +1 and +2 SDs from the mean were compared to mean BMI at each age. Three separate models were fitted investigating the effect of change in BMI in different periods (4–7, 7–15 and 15–26 years) on mortality. Each model included a BMI velocity and the baseline BMI for that velocity.
To assess whether any impact of childhood and adolescent BMI was independent of birth weight and to assess whether it was mediated by the later BMI trajectory, childhood BMI was successively adjusted for birth weight, childhood and adolescent BMI velocities and adult BMI (age 26 years). BMI at 15 and 20 years were adjusted for BMI at age 26 years. In final models we also adjusted for father's occupation, own educational level and smoking history. All these adjusted analyses were carried out on the sub-sample with complete data for all variables. Finally, we tested the association between BMI at age 36 years and all-cause mortality with mortality follow-up from 36 years. All analyses were conducted in Stata 10.1.20
Results
The BMI trajectory followed broadly the same pattern for men and women; BMI decreased from age 2 years to age 7 years, increased towards age 20 years and then levelled out but still increased towards age 36 years (table 1).
In women, BMI at age 4 years showed a U-shaped relationship with mortality (p=0.02) (figure 1C and table 2). The HR comparing women with low BMI (2 SDs below the mean) to those of mean BMI (16.1 kg/m2) was 2.13 (95% CI 0.97 to 4.70). The HR for women with BMI 2 SDs above the mean was 1.67 (95% CI 0.85 to 3.28). BMI at age 2 years showed a similar pattern, but was not significant at the 5% level (figure 1A). In men, no significant overall association was found for BMI at ages 2 or 4 years. At age 4 years, male children with high BMI exhibited a lower mortality rate than those with lower BMI. BMI at ages 6, 7 and 11 years showed no overall association with adult mortality in men or women (figure 1E–J).


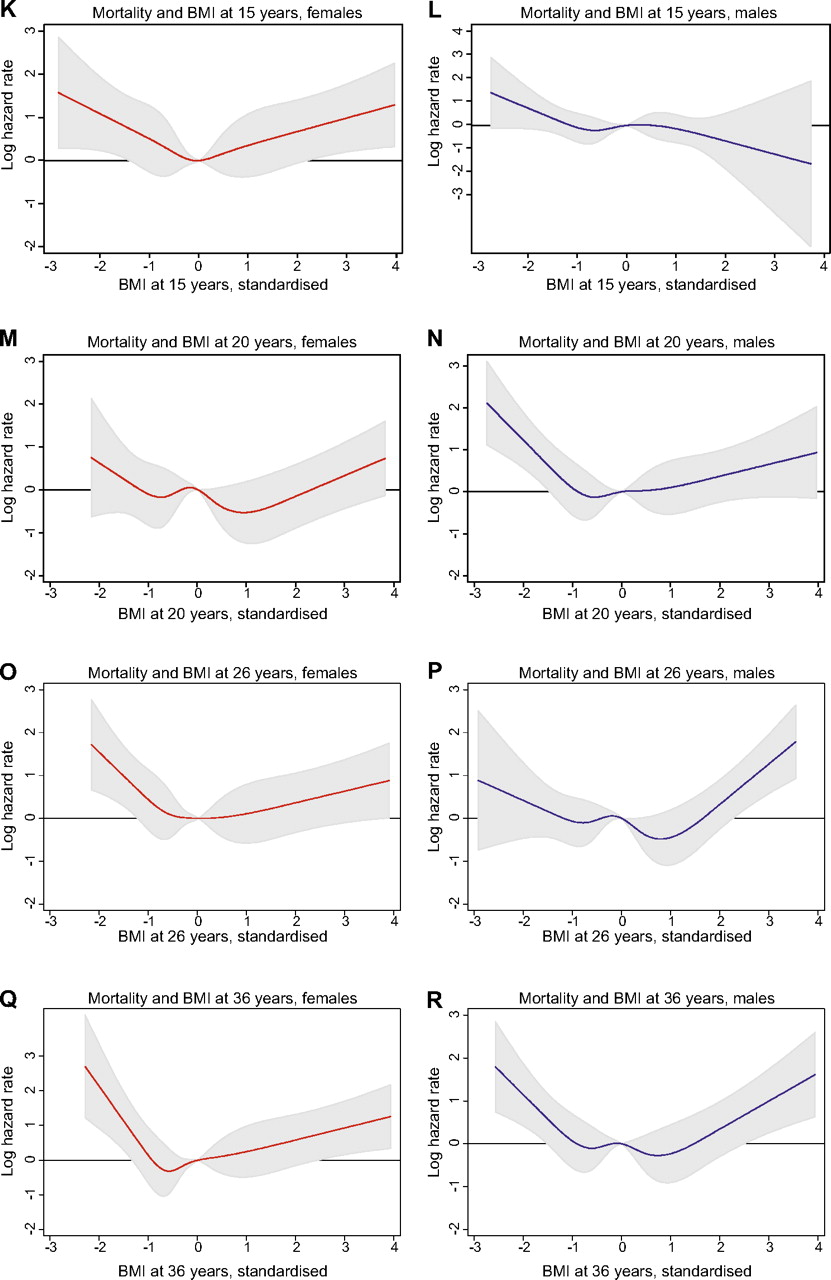
Body mass index (BMI) (kg/m2) and log mortality HRs (with 95% CI bands) at ages 2, 4, 6, 7, 11, 15, 20, 26 and 36 years. Reference point is BMI value 0 (=mean BMI), and log hazard rate is compared to this reference point for all other BMI values. Log HRs are estimated in Cox regression using cubic splines. (A) Overall p=0.46; (B) overall p=0.64; (C) overall p=0.02; (D) overall p=0.18; (E) overall p=0.93; (F) overall p=0.53; (G) overall p=0.66; (H) overall p=0.95; (I) overall p=0.63; (J) overall p=0.16; (K) overall p=0.02; (L) overall p=0.31; (M) overall p=0.02; (N) overall p=0.001; (O) overall p=0.02; (P) overall p<0.001; (Q) overall p=0.01; (R) overall p<0.001.
Unadjusted mortality HRs (with 95% CI) at selected body mass index (BMI) (kg/m2) SDs at ages 2, 4, 6, 7, 11, 15, 20, 26 and 36 years. (Results correspond to figure 1). HRs predicted from Cox regressions using cubic spline models
In female adolescents, high and low BMI at age 15 years increased the mortality risk (p=0.02): low (2 SDs below mean) versus mean BMI: HR 2.96 (95% CI 1.26 to 6.97); high (2 SDs above mean) versus mean BMI: HR 1.97 (95% CI 0.95 to 4.10) (figure 1K and table 2). In male adolescents, lower BMI at age 15 years was associated with higher mortality risk, but the relationship was not significant.
BMI at ages 20, 26 and 36 years were related to mortality and the relationships were U-shaped in both sexes (figure 1M–R).
There were no statistically significant associations between BMI velocities and mortality risk (results not shown). In male adolescents, BMI gain from age 7–15 years was associated with decreased mortality rates (HR for 1 SD increase was 0.79, 95% CI 0.62 to 1.01; p=0.06).
Adjusted analyses
The sub-samples of respondents with complete data on all variables used in analyses (in tables 3 and 4) did not differ from the full sample in regards to overall mortality rate, initial mean BMI or childhood social class distribution. Among female children, the unadjusted U-shaped association at age 4 years was stronger than in the larger sample (table 2). The association persisted after adjustment for birth weight (table 3). Further adjustment for BMI velocities and adult BMI attenuated the increased risk for those with low BMI, but the increased risk for those with high BMI was strengthened. The association was robust against further adjustment for childhood social class, educational level at age 26 years and smoking. The non-significant negative association among men changed only slightly after adjustments.
Body mass index (BMI) (kg/m2) at age 4 years and mortality HRs (with 95% CI), adjusted successively for birth weight, BMI velocities, BMI at 26 years and confounders* (sample is those with non-missing observations on all variables; 1152 males and 1112 females).
Body mass index (BMI) (kg/m2) and mortality HRs (with 95% CI) at ages 15 and 20 years, adjusted for BMI at 26 years and confounders* (sample is those with non-missing observations on all variables)
In female adolescents, the U-shaped association at age 15 years was attenuated after adjustment for adult BMI but strengthened again after additional adjustment for the confounders (table 4). In male adolescents, the protective effect of high BMI at age 15 years was more pronounced in the sub-sample than in the full sample, and was robust against adjustment for adult BMI and confounders. In men, the increased risk for those with high BMI at age 20 years was considerably reduced when adjusted for BMI at age 26 years and confounders (table 4). However, the increased risk for men with low BMI persisted, and was strengthened after adjustment for adult BMI, and the association in the fully adjusted model remained significant. In women, the association at age 20 years was attenuated when adjusted for BMI at age 26 years.
Findings using a categorical variable based on cut-offs from Cole's index were similar to those using splines and, thus, are not presented.
Discussion
In women, BMI from adolescence (15 years) onwards showed a consistent U-shaped relationship with adult mortality and a similar relationship occurred in men from early adulthood (20 years). BMI at most of the earlier ages did not show any relationship. The relationship of adolescent BMI with adult mortality in women was partially attenuated by adult BMI. In early adulthood, the U-shaped association was mediated by later BMI although the increased risk among those of low BMI persisted in men.
Advantages and limitations
This study is unique in being able to relate BMI across life with adult mortality and to assess whether any early life association is a result of tracking of BMI into adulthood or due to confounding variables from across the life course. Heights and weights in childhood and adolescence, from which BMI was calculated, were measured rather than being self-reported. Heights and weights were self-reported at ages 20 and 26 years, and, particularly among men, the association of BMI with mortality at age 20 years was stronger and of a different shape to that observed with measured BMI at age 15 years. However, if study members tended to under-report their weight this would have been likely to dilute rather than strengthen the association between high BMI and mortality. Further, the comparability of the associations with mortality of BMI at age 26 years and BMI at 36 years suggests that any bias is likely to be small. In contrast to our study, most previous studies have been larger, but without this detailed information on BMI in childhood, adolescence and adulthood or on confounding variables.
BMI is the only measure of adiposity available in earlier life in the NSHD and, although it is not the most ideal measure of adiposity in children and adolescents, it is considered a reasonable measure of fatness.23 The lack of obese children and adolescents in the NSHD may mean that we lacked statistical power to assess the impact of early life obesity on adult mortality. At 4 years, where we do observe a relationship, and at 2 years, a BMI above 2 SDs in our sample would be regarded as obese according to Cole's index.21 However, being above 2 SDs at ages 6, 7 and 11 years would not be defined as obese, although they would be overweight. For example, in 11-year-old male adolescents, the BMI corresponding to 2 SDs above the mean was 21.6 kg/m2. In comparison, Cole defines obesity as 25.1 kg/m2 (overweight has cut-off 20.6 kg/m2).21 Therefore, stronger relationships at these ages may be observed in more recent cohorts with greater levels of childhood obesity. Thus, it is unclear whether the results are generalisable to contemporary cohorts where the distribution of BMI is different to that observed in the 1946 cohort. However, contemporary cohorts do not have mortality outcomes to be able to assess the relationship of interest. Although the lack of associations observed here in relation to childhood BMI may be due to the lack of obese children, it is also possible that high childhood BMI is not a risk factor for mortality. For example, it has been suggested that childhood obesity may not result in a greater CVD risk if other risk factors remain well-controlled in the intervening years.24 In addition, the findings do apply to the adult population of today, as a British cohort born in 1958 cohort had very similar childhood BMI to the 1946 cohort,25 and might shed some light on current mortality patterns.
Survival bias may have influenced our findings since follow-up for mortality began at age 26 years. Additional analyses of those dying before age 26 years showed no differences in birth weight or early BMI compared to those included in our analysis. Selection bias might also exist in the adjusted models since these were based on subsamples. However, the sub-samples did not differ from the full sample with regards to mortality rates, BMI or childhood class and the unadjusted associations were very similar to those observed in the full sample. This suggests that the sub-samples are representative of the full sample.
Comparisons with other studies
The few studies that have investigated the relationship between childhood BMI and adult mortality have produced conflicting findings.6–8 However, unlike our study, these previous studies have BMI measured on each participant only once during early life. Further, since all are based on age heterogeneous cohorts, the measure of BMI is recorded over a wide range of ages from early childhood to adolescence.
A J-shaped relationship between childhood BMI, measured once when the cohort was aged between 2 and 14 years in 1937–1939, and all-cause mortality was suggested in the British Boyd Orr Cohort.6 The increased mortality among the underweight was only significant when BMI was measured before 8 years. This fits with our findings where the strongest association with childhood BMI was observed at age 4 years. Two other studies found higher relative weight in childhood/adolescence to be associated with increased mortality rates for both sexes.7 ,8 One of these with relative weight measured at ages 5–18 years8 found that, in agreement with our results for BMI at age 15 years, high post-pubertal relative weight was only harmful among female adolescents. The other study did not distinguish the effects of childhood from adolescent weight.7
High adolescent BMI has been consistently associated with increased adult mortality, at least in men.9 ,11–14 ,26 Some studies have shown a U-shaped relationship similar to that seen in women in the current study. In the Caerphilly study, male obesity at 18 years, based on recalled weight when study members were aged 45–59 years, was related to increased adult mortality risk14 and there was a tendency towards increased risk for men reporting low adolescent BMI (<20.1 kg/m2). We also observe such a non-significant tendency towards increased risk with low BMI at age 15 years in men and a significant effect at age 20 years; an age which is closer to the 18 years at which the Dutch cohort was measured and the reports from Caerphilly. Neither of these previous studies presented analyses adjusted for adult BMI. A large Norwegian cohort study found high BMI in adolescence to be predictive of increased adult mortality in the following 26 years,11 which persisted after adjustments for adult BMI among women but not among men.9 ,12 We found that the effect of low BMI at 15 years among women was partially explained by adult BMI, and that the excess mortality risk for high BMI at age 20 years among men was mostly explained by adult BMI. The Harvard Growth Study of 1922–1935 also produced different findings for men and women as overweight men, but not women, adolescents had increased adult mortality, which was independent of adult self-reported BMI.13
In line with our findings, obesity in adulthood has been consistently related to later increased all-cause mortality rates in both men and women, and most studies also report increased mortality risk for the underweight.27 We find a persistent effect of low BMI at age 20 years among men after adjustment for BMI at age 26 years.
Interpretation and implications
Women have been found to be more likely than men to have overweight tracking from childhood into adulthood,4 which might explain the sex difference in association of BMI at ages 4 and 15 years in our study. However, the impact of BMI at age 4 years on mortality in women was not explained by adult BMI suggesting that BMI tracking is not the full explanation for the findings. BMI in childhood has been found not to be strongly related to percentage adult body fat.28 In addition, low tracking of obesity from childhood to adulthood in the NSHD has previously been reported.4 ,29 This low tracking may be expected in cohorts such as the NSHD born in the immediate post World War II period who experienced very different environmental conditions compared to children in later cohorts.13 In later cohorts, tracking of BMI from childhood to adulthood has been consistently demonstrated.13
The increased risk among those of low BMI could be a result of reverse causality whereby those that are underweight are already ill. However, it is unlikely that this provides the full explanation for our findings for BMI at age 4 years as mortality follow-up was from age 26 years; thus, excluding childhood mortality.
Childhood growth has been found to be associated with numerous health outcomes in the NSHD and other studies. Both high and low BMI have been found to be associated with increased risks depending on whether considering BMI in childhood or adolescence and depending on the health outcome of interest.30–32 High childhood BMI has been found to be related to metabolic syndrome suggesting that continuous obesity from childhood to adulthood serves as a generator for prolonged insulin resistance, which results in clustering of CVD risk factors.5 Previous findings from the NSHD suggested that large increases in BMI during adolescence had a detrimental influence on adult blood pressure30 and high-density lipoprotein cholesterol.31 Hence, the influence of high BMI in adolescence on such cardiovascular risk factors and subsequent CVD mortality may explain the association between high adolescent BMI and mortality. Fast increases in BMI in childhood were associated with an increased rate of breast cancer in the NSHD,33 which might partially explain the high mortality rate in women with high childhood and adolescent BMI.
Since, the cohort experienced post-World War II food rationing, it is possible that the increased mortality risk in those of low BMI in childhood is related to the impact of childhood under-nutrition on adult health.6 In a British cohort born in 1947, underweight children had elevated blood pressure and cholesterol levels in later life.28 Low birth weight has consistently been related with higher CVD and type 2 diabetes risk34 and CVD risk factors.35 ,36 However, birth weight did not explain the excess mortality for low BMI at age 4 years in our study.
Differences in accumulation of fat and muscle mass during childhood and adolescence between boys and girls may be an explanation for the sex differences in association between BMI and mortality. Locus of fat distribution during adolescence has been suggested as an explanation for the association between adolescent BMI and mortality.37 High BMI is likely to indicate a larger percentage of muscle mass in male adolescents, which indicates robustness and later lower mortality. In women, high BMI at age 15 years represents a larger percentage of fat mass that is harmful to later health. This is supported by previous findings from the study, which showed that increased BMI between 7 and 15 years was associated with adult grip strength in men but not in women.38 Further, boys mature later than girls and this may be why a U-shaped relationship was observed in women at age 15 years but the association was not seen in men until age 20 years.
Conclusion
We show that the U-shaped relation between adult BMI and premature mortality in a post-war British birth cohort is evident from age 20 years in men and age 15 years in women. BMI at most younger ages did not show such a relationship. These findings suggest that public health interventions aimed at promoting the maintenance of a normal BMI during adolescence and early adulthood may prevent premature adult mortality in more recent cohorts.
What is already known on this subject
Adult body mass index (BMI) is consistently found to have a U-shaped relation to mortality.
Less is known about the impact of earlier life BMI on adult mortality.
What does this study adds
We show that BMI from adolescence (15 years) onwards showed a consistent U-shaped relationship with adult mortality in women.
A similar relationship occurred in men from early adulthood (20 years).
BMI at most of the earlier ages did not show any relationship with adult mortality.
The relationship of adolescent BMI with adult mortality in women was partially attenuated by adult BMI. In early adulthood the U-shaped association was mediated by later BMI, although the increased risk among those of low BMI persisted in men.
References
Footnotes
Funding The study is funded by the MRC Unit for Lifelong Health and Ageing, UK, and supported in part by the Intramural Research Program, National Institute on Aging, NIH, USA. The funders of the study had no role in the study design, data collection, data analysis, data interpretation or writing of the report.
Competing interests None.
Ethics approval Obtained from the Multicentre Research Ethics Committee (MREC).
Provenance and peer review Not commissioned; externally peer reviewed.