Article Text

Abstract
Background Contact patterns and vaccination decisions are fundamental to transmission dynamics of infectious diseases. We report on age-specific contact patterns in Japan and their effect on influenza vaccination behaviour.
Methods Japanese adults (N=3146) were surveyed in Spring 2011 to assess the number of their social contacts within a 24 h period, defined as face-to-face conversations within 2 m, and gain insight into their influenza-related behaviour. We analysed the duration and location of contacts according to age. Additionally, we analysed the probability of vaccination and influenza infection in relation to the number of contacts controlling for individual's characteristics.
Results The mean and median reported numbers of daily contacts were 15.3 and 12.0, respectively. School-aged children and young adults reported the greatest number of daily contacts, and individuals had the most contacts with those in the same age group. The age-specific contact patterns were different between men and women, and differed between weekdays and weekends. Children had fewer contacts between the same age groups during weekends than during weekdays, due to reduced contacts at school. The probability of vaccination increased with the number of contacts, controlling for age and household size. Influenza infection among unvaccinated individuals was higher than for those vaccinated, and increased with the number of contacts.
Conclusions Contact patterns in Japan are age and gender specific. These contact patterns, as well as their interplay with vaccination decisions and infection risks, can help inform the parameterisation of mathematical models of disease transmission and the design of public health policies, to control disease transmission.
- COMMUNICABLE DISEASES
- Disease modeling
- INFLUENZA
- PUBLIC HEALTH POLICY
This is an Open Access article distributed in accordance with the Creative Commons Attribution Non Commercial (CC BY-NC 4.0) license, which permits others to distribute, remix, adapt, build upon this work non-commercially, and license their derivative works on different terms, provided the original work is properly cited and the use is non-commercial. See: http://creativecommons.org/licenses/by-nc/4.0/
Statistics from Altmetric.com
Introduction
Human contact patterns are fundamental to the transmission dynamics of infectious diseases. Changes in contact patterns may even determine whether an outbreak spreads or dies out. Consequently, human contact patterns, particularly as they interplay with vaccination behaviour, need to be taken into consideration when designing effective public health policies.1 ,2
Age-specific contact patterns have been estimated for Europe3–5 and the USA,6 and have been extensively used to parameterise models of disease transmission in these locales. Despite the importance of Asia as the world's most populous continent and also the location of emergence of many diseases, little is known about human contact patterns in Asian countries (see online supplementary S1).7 ,8 As a result, models of disease transmission and the policies that they inform have been based on the contact data from Western countries.
It has yet to be evaluated whether the age-specific contact patterns characterised in Western countries are robust to cultural, sociological and demographic differences between Western and Asian countries. For example, cohabitation of adult children with their elderly parents is common in Japan.9 The proportion of households with children is 46.0% in Japan, significantly greater than the 38.9% in the USA.10 In addition, Japan has the oldest population in the world, with more than 20% of people over 65 years.11 One would therefore expect that contact patterns in Japan might differ significantly from those in Western countries.
In turn, the interplay between social contact patterns and healthcare decisions, such as the choice of whether to be vaccinated or not, can have a significant impact on disease transmission dynamics. For example, individuals with a greater number of contacts are more likely to be infected as well as more likely to transmit infection. Consequently, vaccination of these highly connected individuals would disproportionately reduce transmission.12 ,13 Identifying vaccination behaviour of individuals who have the greatest number of contacts could facilitate determining targets for vaccination promotion and prioritisation.
Using original survey data, we explore age-specific social contact patterns in Japan and the interaction of these patterns with household demographic structure. The objective of the study is to understand the nature of social contact patterns and to provide fundamental parameters to epidemiological models of disease transmission. This is the first study to quantify age-specific and gender-specific social contact patterns in Japan. We also evaluate how the number of contacts predicts their vaccination decisions as well as their respective risk of influenza infection to understand interplays between influenza-related behaviours.
Methods
Survey design
Our survey was conducted between 6 April and 9 May 2011 as part of a biannual survey on influenza health status and behaviour by the Infectious Disease Surveillance Center of the National Institute of Infectious Diseases in Japan. The survey consisted of two parts: part I focused on individual characteristics, household structure and influenza-related questions such as vaccination and influenza diagnosis in the previous year; and part II focused on social contact patterns (see online supplementary S2). Households were stratified into those with: (1) only elderly individuals (over 65 years old), (2) at least one child between 6 months and 12 years old, (3) combination of elderly and younger individuals, and (4) those not included in (1), (2) or (3). In the analysis, we adjusted for the distribution of household size to match the actual distribution of the Japanese population. For individuals in stratum (1), a survey invitation was randomly sent either online or by mail. For those individuals in strata (2)–(4), the survey was only conducted online. The survey participants were those who were registered to the survey company, and they gained points for survey participation and accumulated the points to receive benefits from the survey company. We did not provide any additional benefit for the particular survey participation. Prior to the survey, respondents were randomly assigned to answer survey questions on social contacts on their own behalf or on behalf of a household member aged either under 19 or over 65 years. Those asked about their household members were given the option of breaking to consult with their household members. Respondents are individuals who directly responded to the survey and those whose behaviour was recorded are participants. For example, if a mother responded on behalf of a child, the mother was a respondent and the child was a participant. Participants were instructed to make their best guess when they did not know the exact information about the age of their contacts.
Among 4331 respondents who answered part I of the survey, 4043 (93.4%) respondents agreed to answer part II and, of those, 2441 (60.4%) answered regarding their own contacts, and 1602 (39.6%) answered regarding a household member. Our analysis only included respondents who completed the entire survey (N=3146 (72.6%)) (see online supplement S3).
Part I: Individual characteristics and household structure
The survey asked about individual characteristics, such as age, gender and household structure. The survey also asked about influenza-related questions, which included information on vaccination decisions and influenza diagnosis in the previous year.
Part II: Social contact patterns
Respondents were asked to record all contacts the previous day from 00:00 to 23:59. Contacts were defined as face-to-face meetings with words exchanged within a distance of 2 m, a proxy for exposure to air-borne pathogens.3 For each contact, the participant was asked to record the location (house, workplace, school, travel, restaurants or bars, other), age (0–2, 3–5, 6–11, 12–14, 15–19, 20–29, 30–39, 40–49, 50–59, 60–69, 70–79 and 80 years or above) and duration of contact (less than 5, 5–14, 15–59 min, 1–3 h and 59 min, and 4 or more hours).5 Participants were asked to provide the number of unique individuals with whom they interacted, as distinct from the number of conversations with each contact.14
Statistical analysis
We analysed the number of contacts by age, gender, household size, number of children in the household, day of the week and social contact pattern between the 12 age groups. In all analysis, we used a weight to adjust the distribution of household size. For the distribution of time and location of contacts, we first calculated the proportion of each category for location or time for a participant, and then obtained the weighted average over the sample.
We conducted a probit regression to examine the relationship between vaccination decisions and the number of reported contacts. The model was specified as: 1
1
where Φ is the cumulative distribution function of the standard normal distribution. The dependent variable was vaccination yi status represented by a binary variable assigned the value of one if the participant was vaccinated against influenza in 2010, the preceding year of the survey. We ran two regressions. First, the row vector xi included the number of contacts, age, gender, household size and a constant term. Second, we included the squared values of age and the number of contacts together with the set of independent variables in the first regression. β shows a column vector that contains the coefficient of each variable.
In addition, we conducted a probit regression denoted by equation (1), in which the dependent variable yi was influenza infections in the 2010/2011 season, to analyse how two behavioural factors—social contacts and vaccination—were related to the risk of influenza infection. Again, we ran two regressions with and without the squared terms of age and the number of contacts. Influenza infections were defined as a binary variable, assigned a value of 1 if participants reported that they received an influenza diagnosis and 0 otherwise. We reported marginal effects and their 95% CIs.
Results
Number of contacts overall
We found that the distribution of reported number of daily contacts was skewed towards the right with a mean of 15.3 (95% CI 14.4 to 16.3) and a median of 12, with a disproportionate fraction having most of the contacts (figure 1). Specifically, 20% of the participants accounted for 75% of the total number of reported contacts. Additionally, we found on average 3.51 (1.23 to 5.79) more contacts during weekdays than on weekends.
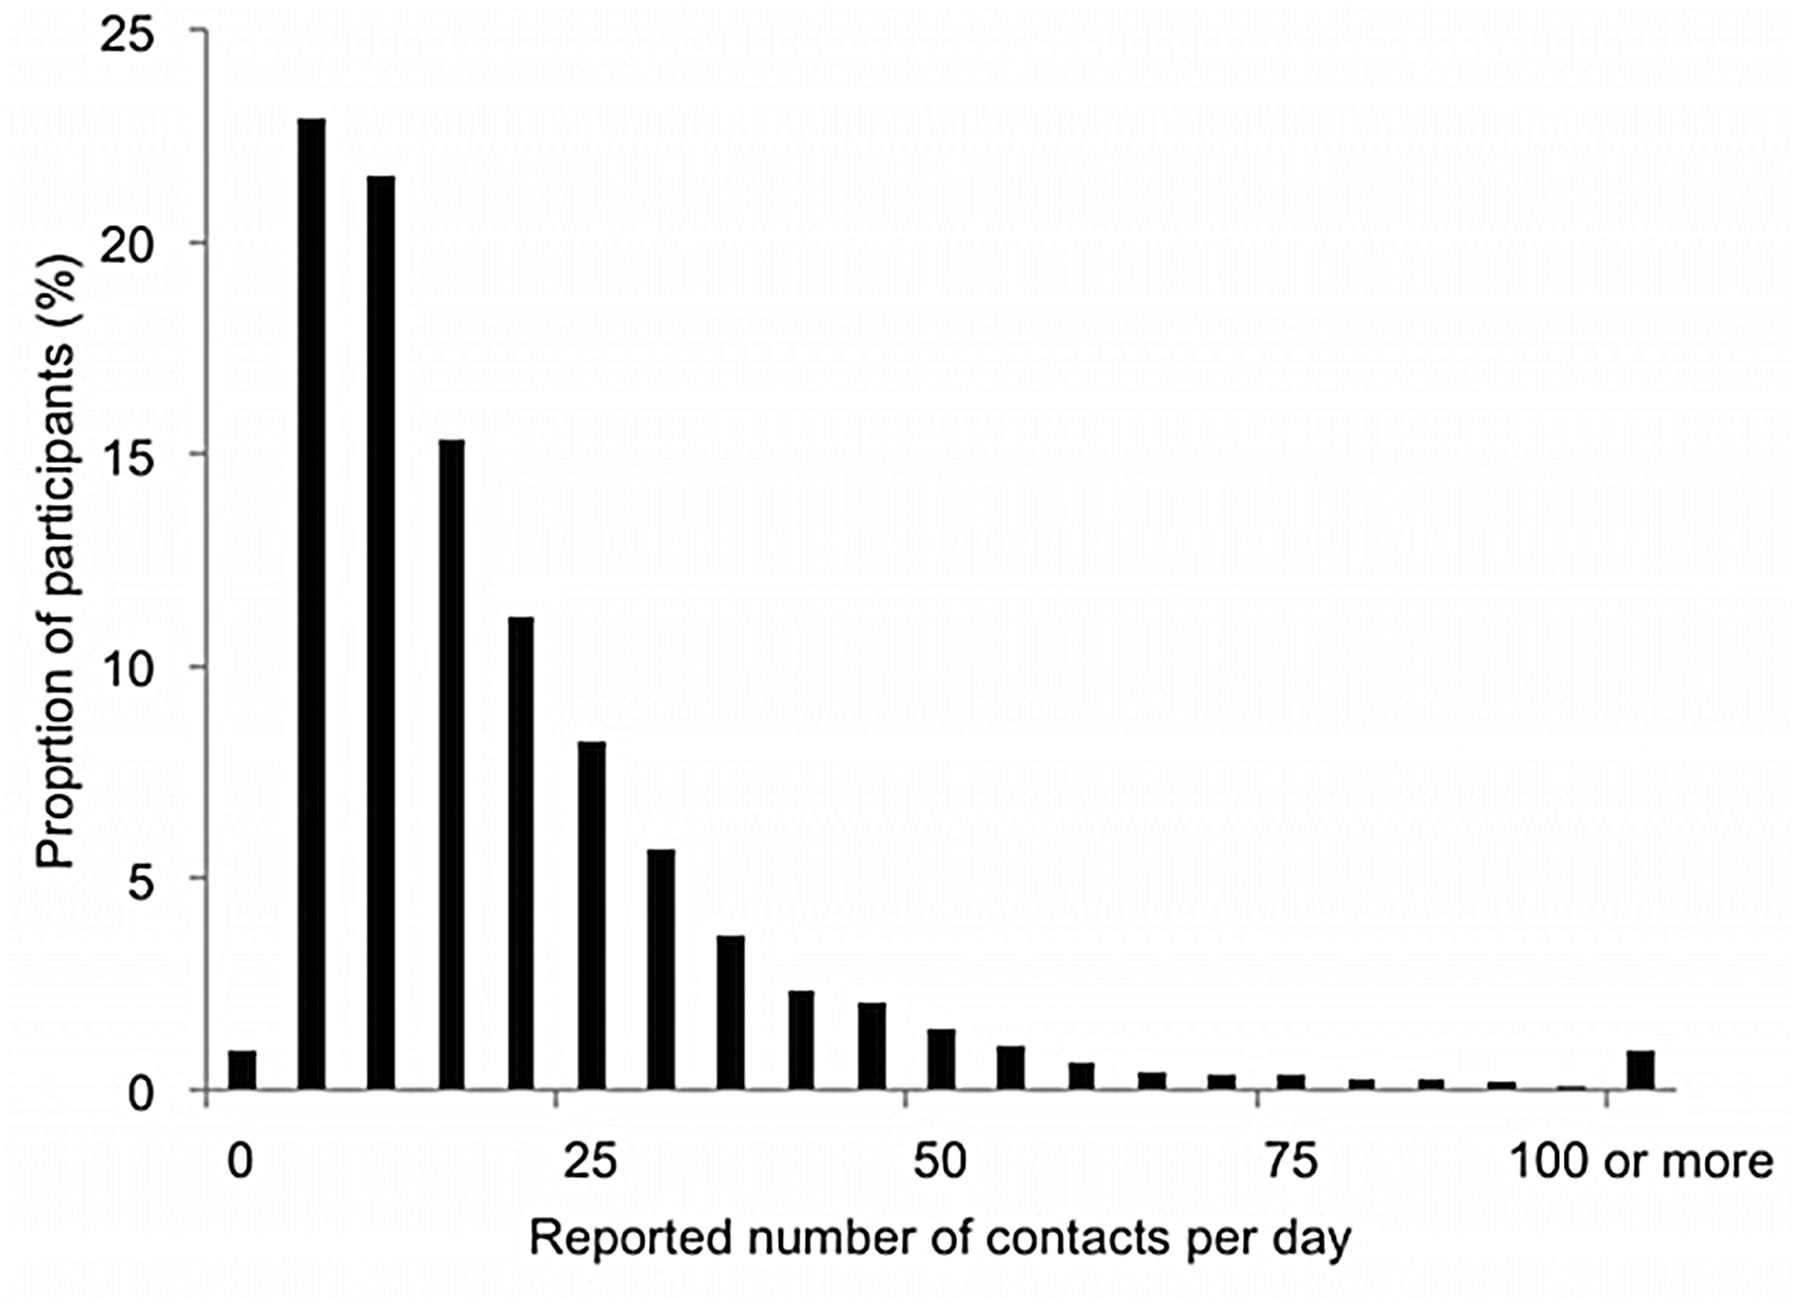
Distribution of daily number of contacts.
Number of contacts stratified by sex, age and household size
School-aged children and young adults had more contacts than other ages, highest for individuals aged 20–29 years, followed by individuals aged 15–19 and 6–11 years. The number of contacts gradually decreased with age for those aged 30 years or above, and the elderly reported fewest contacts (table 1).
Mean number of reported contacts by participants’ and household characteristics and date of contacts
We found that households with three or more members reported a greater mean number of contacts than those with one or two, by 5.93 (4.40 to 7.47) contacts per day. For participants aged 19 years and above, contacts increased with the number of children in the household (table 1).
Duration and location of contacts
Our findings show that 62.7% (60.9% to 64.6%) of the daily contacts lasted less than 1 h (figure 2A). For those under 12 years of age, 48.1% (45.6% to 50.6%) of the conversations were 1 h or longer. Furthermore, participants 0–2 years of age reported the highest proportion of contacts that were 4 h or longer among all age groups, indicating more intensive interactions for the youngest individuals (figure 2A).

Distribution of duration and location of contacts; (A) duration by participants’ age group; (B) location by participants’ gender; (C) location by participants’ age group.
Of the contacts, 36.3% (34.4% to 38.2%) occurred at home (figure 2B), with a higher proportion of household contacts within the youngest and oldest age groups (figure 2C). The frequency of contacts in other locations varied with age group (figure 2C). For school-aged children aged between 3 and 14 years, the majority of contacts occurred at school (ranging from 33.6% (28.8% to 38.4%) for 3–5-year-olds to 46.3% (40.8% to 51.8%) for 12–14-year-olds). For those between ages 20 and 59 years, the primary location of contacts outside of the home was in the workplace (ranging from 21.1% (18.0% to 24.1%) for 30–39-year-olds to 32.9% (24.8% to 41.0%) for 50–59-year-olds). For those aged 60 years or above, 48.3% (42.7% to 53.9%) occurred outside home or workplace.
Age-specific mixing patterns
Participants in all age groups reported more contacts between individuals in the same age group than in other age groups, indicating an age-specific assortative relationship (figure 3). Age-specific assortativity was most pronounced among school-aged children and young adults. Specifically, for school-aged children, the ratio of the observed mean number of reported contacts to the expected number of contacts assuming random-mixing ranged from 13.02 for individuals aged 6–11 years to 23.86 for individuals aged 12–14 years (see online supplementary S4).

Age-specific mixing patterns between 13 age groups in Japan, based on survey data. The figure shows the reported number of contacts per day between any two age groups. Age groups (in years) are defined as: 0–2, 3–5, 6–11, 12–14, 15–19, 20–29, 30–39, 40–49, 50–59, 60–69, 70–79 and 80 years or above.
Children had fewer contacts with other children of the same age on weekends than during weekdays (weekdays–weekends: 1.50 (0.95 to 2.90) for 0–2-year-olds; 10.49 (7.64 to13.33) for 3–5; 11.41 (9.16 to13.65) for 6–11; and 7.26 (3.29 to 11.24) for 12–14-year-olds), due to reduced contact at school or daycare (see online supplementary S5).
Different mixing patterns by gender were observed in different age groups (see online supplementary S6). Among individuals aged 20–59 years, women had more contacts than did men with children aged younger than 15 years (women–men: 1.58 (0.87 to 2.29)), whereas men aged 20–59 years had more contacts than women did with adults aged 20–59 years (men–women: 2.81 (1.15 to 4.48).
With the exception of working-age adults, participants in Japan reported a greater proportion of contacts with those in the same age group than participants in Europe (see online supplementary S7). The proportion of reported contacts with the elderly aged 60–79 years reported by participants aged under 15 years was greater in Europe than in Japan.
Number of contacts and vaccination status
Our analysis of the association between the number of contacts and vaccination status showed that individuals who had more contacts reported a greater probability of vaccination, but the CI of the marginal effect ranged widely around zero (table 2A). Inclusion of the quadratic terms of the number of contacts and age shifted the CI substantially, suggesting a non-linear effect of the number of contacts on the decision to be vaccinated. The predicted probabilities of vaccination were 49.2% (45.3% to 53.0%), 51.1% (48.5% to 53.7%), 54.4% (49.9% to 58.9%) and 56.2% (48.9% to 63.4%) at 1, 10, 30 and 50 contacts, respectively. Regression analysis showed that age was a predictor of vaccination. Sex did not affect vaccination status, and neither did household size, once we controlled for other covariates.
Marginal effect of number of contacts on vaccination status and influenza infection, controlling for age, sex, household size
Number of contacts and influenza infections
Our analysis also showed that the number of daily contacts was a weak predictor of influenza infection (table 2B). A regression analysis without age and household size showed a greater marginal effect of the number of contacts of 0.0024 (0.0011 to 0.0037), suggesting that the impact of the number of contacts on the risk of infection was mediated by age and household size. Consistent with this, the risk of infection decreased with age. The predicted probability of infections for 10-year-olds who had a median of 12 daily contacts was 14% (12.3% to 16.7%); 5.9% (4.6% to 7.1%) for those aged 40 years; and 1.9% (0.3% to 3.4%) for those aged 70 years. Household size was positively associated with the risk of infection.
The risk of influenza infection was lower for vaccinated people. The predicted probability of influenza infection was 6.8% (5.5% to 8.0%) for vaccinated people and 8.4% (7.1% to 10.0%) for unvaccinated people, evaluated at their median number of 12 contacts.
Discussion
We examined social contacts in Japan to quantify the mixing pattern within and between different age groups, as well as to understand how they are related to influenza transmission and decision-making regarding vaccination. We found that the mean number of 15.3 contacts per person daily in Japan was higher than in most European countries,5 likely due to the high population density in Japan. In contrast, the number of contacts is only 7.95 in Germany5 and 7.7 in rural Vietnam.7 The age-specificity of contacts in Japan also exhibited more pronounced assortativity than in Western countries.3 ,5 Related to this point, our results showed a smaller proportion of contacts between the elderly population and children in Japan, than that in European countries,5 suggesting an ageing society with a higher proportion of the elderly does not necessarily increase an interaction between non-elderly and elderly populations. The contact distribution in Japan indicated super-spreaders, with a small fraction of the population having most of the contacts.15
Our results indicate that the number of contacts is a predictor of infection risk. We further found an association between the number of contacts and influenza vaccination status. This association can have multiple interpretations, and any policy implications based on our results depend on the interpretation of this association. First, the number of contacts may influence influenza vaccination decisions because individuals with more contacts perceive a higher risk of influenza infection or transmission and take more precautionary measures to reduce these potential risks or to protect others. Secondly, it is also possible that the causative relationship acts in the other direction, such that the number of contacts is determined by vaccination behaviour. That is, people who were vaccinated tend to meet more people as they are aware of a lower risk of influenza infection. Third and finally, individuals who are more prosocial would have a greater tendency both to be vaccinated to protect others16 and to have more social interactions.
We found a difference between weekdays and weekends in the number of contacts and in the age-specific contact patterns, consistent with European studies.5 Thus, the effectiveness of control measures for disease outbreaks may differ for weekdays and weekends. Moreover, our data on social mixing patterns during weekends as well as data on locations of the contacts can facilitate evaluations of interventions that differentially impact weekdays and weekends, such as school and workplace closures.
Age-specific contact patterns provide fundamental parameters for mathematical models of disease transmission, which are used to determine infectious disease dynamics and to evaluate the effectiveness of intervention strategies. We found that Japanese school-aged children had more contacts than other age groups, which is likely a primary driver of the higher risk of influenza infection and transmission among children, as has been shown in other countries.1 ,17–20 Consequently, the prioritisation of vaccination of school-aged children may be an effective control strategy to reduce transmission and curtail outbreaks.1 This runs counter to current Japanese influenza immunisation policy that recommends vaccination for those over 65 years of age and those over 60 years of age with chronic health conditions.21
Although our survey provides unique data on social contacts in Japan, some limitations exist. First, online survey studies often report a bias in the distribution of the selected sample in participants’ characteristics.22 Response attrition in the elderly population is a common challenge that we tried to mitigate by using a mail survey for that population. Second, while we had a large sample across Japan, the 20–29-year age group is marginally under-represented compared to census data in Japan. Third, we used a retrospective survey instead of real-time diaries, which introduces the risk for potential recall bias. Any such recall bias would likely be in the direction of underestimation of contacts. Given that the number of contacts recorded was higher than in most of the countries studied using real-time diaries, the effect of such recall bias is likely not substantial.
We evaluated fundamental characteristics of social contacts and mixing patterns as well as associations with vaccination behaviour and influenza infections in Japan. Our data provide important information for the parameterisation of mathematical models of disease transmission, particularly in the context of influenza. Moreover, our findings may help policy makers to develop effective public health strategies against seasonal and pandemic influenza, as well as other infectious diseases.
What is already known on this subject?
Age-specific contact patterns have been estimated for Europe and the USA, and have been extensively used to parameterise models of disease transmission to predict disease trajectory. However, little is known about human contacts in Asia, which is the world's most populous continent and the location of emergence of many diseases. In addition, the interplay between social contact patterns and healthcare decisions that can have a significant impact on disease transmission dynamics has not yet been studied.
What does this study add?
This study is the first to quantify age- and gender-specific social contact patterns in Japan. Using original survey data on social contacts, we further evaluated the interaction of the number of social contacts with vaccination decisions on social contacts. We found that the probability of vaccination increased with the number of contacts, controlling for age and household size. The contact patterns and their interplay with vaccination decisions can help to inform the design of public health policies to disease transmission.
Acknowledgments
The authors thank Eli Fenichel and Jan Medlock for comments and discussions.
References
Supplementary materials
Supplementary Data
This web only file has been produced by the BMJ Publishing Group from an electronic file supplied by the author(s) and has not been edited for content.
- Data supplement 1 - Online supplement
Footnotes
Contributors YI, YO, TS, KT and NO conducted survey. YI and DY analysed the data, and prepared figures and tables. YI, DY, KEA, GBC and APG wrote the manuscript. All the authors approved the final version of the draft.
Funding Japan Society for the Promotion of Science (23830025). National Science Foundation (SES-1227390). Social Science Research Councils (Abe Fellowship). National Institute of Health (U01-GM105627-01). Ministry of Health, Labour and Welfare (Research grant on emerging and re-emerging infectious diseases).
Competing interests YI received the Abe fellowship provided by the Social Science Research Councils and the Japan Center for Global Partnership, Grant-in-Aid for Research Activity Start-up (# 23830025) from the Japan Society for the Promotion of Science, and grant for research on emerging and re-emerging infectious diseases provided from the Ministry of Health, Labour and Welfare, during the period when a part of the analysis was undertaken. APG and KEA acknowledge funding from NIH U01-GM105627–01 and NSF SES-1227390.
Ethics approval National Institute of Infectious Diseases, Japan.
Provenance and peer review Not commissioned; externally peer reviewed.
Data sharing statement All the statistics generated for the publication are shared with anyone on request. The raw individual-level data used for the analysis regarding the number of contacts, infection status, vaccination status and demographic information can be shared with potential collaborators.