Article Text

Abstract
Background Neighbourhood quality has been connected with an array of health issues, but neighbourhood research has been limited by the lack of methods to characterise large geographical areas. This study uses innovative computer vision methods and a new big data source of street view images to automatically characterise neighbourhood built environments.
Methods A total of 430 000 images were obtained using Google’s Street View Image API for Salt Lake City, Chicago and Charleston. Convolutional neural networks were used to create indicators of street greenness, crosswalks and building type. We implemented log Poisson regression models to estimate associations between built environment features and individual prevalence of obesity and diabetes in Salt Lake City, controlling for individual-level and zip code-level predisposing characteristics.
Results Computer vision models had an accuracy of 86%–93% compared with manual annotations. Charleston had the highest percentage of green streets (79%), while Chicago had the highest percentage of crosswalks (23%) and commercial buildings/apartments (59%). Built environment characteristics were categorised into tertiles, with the highest tertile serving as the referent group. Individuals living in zip codes with the most green streets, crosswalks and commercial buildings/apartments had relative obesity prevalences that were 25%–28% lower and relative diabetes prevalences that were 12%–18% lower than individuals living in zip codes with the least abundance of these neighbourhood features.
Conclusion Neighbourhood conditions may influence chronic disease outcomes. Google Street View images represent an underused data resource for the construction of built environment features.
- neighborhood/place
- obesity
- diabetes
- gis
- methodology
This is an Open Access article distributed in accordance with the Creative Commons Attribution Non Commercial (CC BY-NC 4.0) license, which permits others to distribute, remix, adapt, build upon this work non-commercially, and license their derivative works on different terms, provided the original work is properly cited and the use is non-commercial. See: http://creativecommons.org/licenses/by-nc/4.0/
Statistics from Altmetric.com
Introduction
Neighbourhood characteristics influence physical and mental health, health behaviours, and the ability of individuals and families to access necessary resources for maintaining good health. Neighbourhood quality has been connected with mortality risk,1–5 life expectancy,6 mental health,7 self-rated health, obesity8–10 and diabetes11 12—even after accounting for compositional characteristics of residents. Adverse conditions concentrate in poor and minority neighbourhoods,9 13–15 thereby increasing health disparities. In a recent study of Seattle, San Diego and Baltimore, neighbourhoods with lower socioeconomic status and higher proportions of racial/ethnic groups had poorer aesthetics (eg, unmaintained buildings, graffiti, broken windows and litter). Conversely, neighbourhoods with higher socioeconomic status and lower proportions of minorities had better pedestrian amenities in terms of sidewalks, crosswalks and intersection control features.16
Currently, detailed neighbourhood data come from neighbourhood surveys, administrative data such as the census and systematic inventories of neighbourhood features. Subjective assessments of neighbourhoods from community residents help identify factors that residents believe are most important to their health and increase understanding of how individuals differentially use and interact with their environment.17 However, self-reported neighbourhood data can be encumbered by several biases, including same-source bias (when two variables appear correlated because information was gathered using self-reported data on both variables) and social desirability bias (inaccuracies caused by a desire by the respondent to give answers that they think will be viewed favourably).18 19
Neighbourhood audits of built environmental features have heretofore been conducted using costly, time-consuming onsite visits or manual annotation of samples of street segment images. The development of data algorithms that can automatically process street segments to create indicators of the physical environment would dramatically lower costs and offer new resources for neighbourhood research. In this study, we leverage publicly available and pervasive Google Street View images to derive indicators of neighbourhood built environments. Google Street View had captured 20 petabytes of data, equivalent to 5 million miles of road around the world.20 We limit this study to the USA. We obtained permission from Google Street View to use their image data for this research project.
Study aims
The purpose of this study is to construct built environment indicators using computer vision techniques and publicly available Google Street View images, and to examine relationships between neighbourhood built environments, demographic characteristics of residents and health outcomes. We chose the following three cities that differ in landscape characteristics, population density and demographic composition: Salt Lake City, Utah; Chicago, Illinois; and Charleston, West Virginia.
Methods
Street view image collection
We built algorithms to process image data for Chicago, Charleston and Salt Lake City between December 2016 and February 2017. Using Google’s Street View Image API, we obtained image data on all road intersections and a random sample of street segments approximately 50 m apart. At each search location, we obtained street view images to the west, east, north and south to capture features of the environment. Image resolution was 640×640 pixels. In total, 227 000 images were obtained for Chicago, 150 000 for Salt Lake City and 53 000 for Charleston.
Image data processing
Convolutional neural networks21 achieve state-of-the-art accuracy for several computer vision tasks including object recognition, object detection and scene labelling.22–24 To create a training dataset for our computer vision models, we manually annotated 14 000 images. Each image had three binary labels for the following neighbourhood characteristics: (1) presence of a crosswalk (yes/no), (2) building type (single-family detached house vs other) and (3) street greenness/landscaping (street trees and street landscaping comprised at least 30% of the image (yes/no). A cut-point of approximately 30% was used to assist with inter-rater reliability in manual annotations of street greenness. Moreover, we found that most images had some street landscaping and aimed to create a neighbourhood indicator to distinguish between ample and sparse street landscaping. Images were manually labelled by four of the authors. Inter-rater agreement was above 85% for all neighbourhood indicators (86%–96% for crosswalks; 85%–90% for building type; 85%–95% for green30). We randomly divided each labelled image dataset into a training set (80%), used to calibrate the model, and a test set (20%), used to evaluate the trained model’s accuracy. We used a deep convolutional network (Visual Geometry Group 16 model) that is commonly used for object recognition. Three separate networks were trained, one for each indicator of interest. We obtained 84.59%, 85.40% and 93.03% accuracy for the ‘commercial buildings/apartments,’ ‘green-30%’ and ‘crosswalk’ recognition tasks, respectively.
We next experimented with semisupervised learning. In addition to the labelled dataset, we used an unlabelled set containing 226 879 images captured from Google Street View of different neighbourhoods in Chicago. The following steps were used to process the unlabelled images. We resized each unlabelled image to 256×256 and then replicate the image four times. Next, we cropped each replication at a random location into 224×224. Except the first replication, we also matched the histogram of each replicated image to the next three unlabelled images. This approach increased the accuracy to 86.07%, 86.55% and 93.37% for the ‘commercial buildings/apartments’, ‘green-30%’ and ‘crosswalk’ recognition tasks, respectively. (Note: we were unable to leverage unlabelled images in the deep convolutional network approach because unlabelled images can only be used with semisupervised learning approaches.) Image values of neighbourhood features (eg, crosswalks) were then aggregated to produce small area summaries. We used zip code boundaries as a working definition of neighbourhoods. The neighbourhood built environment datasets developed for this manuscript can be downloaded at https://hashtaghealth.github.io/geoportal/start.html
Individual-level health data
We merged our neighbourhood data with individual outcome data from the Utah Population Database (UPDB). Most families in Utah are represented in the UPDB. The central component of UPDB is the extensive set of Utah family histories with links to demographic and medical data. The UPDB contains 19 million records for over 7.3 million individuals. The UPDB is a dynamic database updated annually by data contributors. Multiple records for each individual are linked by a person ID. The UPDB can only be used for biomedical and health-related research. Confidentiality and privacy of individuals are strictly protected. The UPDB is provided by the Pedigree and Population Resource under the direction of Dr Ken Smith.
Health outcomes
Cohort of adults
Our analytic sample consisted of adults aged 20 years and older in 2015 living in Salt Lake City.
Obesity
Obesity was defined dichotomously as body mass index (BMI) (kg/m2)≥30 mg/dL. Self-reported height and weight were extracted from driver licence data. Utah law requires individuals to renew their driver licence every 5 years and to renew in person every 10 years. BMI data were drawn from the most recent driver licence data available, between 2011 and 2017.
Diabetes was assessed via diagnoses by a healthcare provider using International Classification of Diseases, Ninth Revision (ICD-9) ('250.00', '250.01', '250.02', '250.03', '250.70', '250.71', '250.72', '250.73', '250.40', '250.41', '250.42', '250.43', '250.50', '250.51', '250.52', '250.53', '250.60', '250.61', '250.62', '250.63') and ICD-10 codes (E11.40', ’E10.9', ’E10.29', ’E11.51', ’E11.29', ’E11.36', ’E10.36', ’E10.39', ’E10.51', ’E10.40', ’E10.65', ’E11.21', ’E11.319', ’E10.319', ’E11.65', ’E11.311', ’E11.39', ’E10.21', ’E10.311', ’E11.9'). Sources of the clinic data included the University of Utah Health Sciences Center Enterprise Data Warehouse and Utah’s Department of Health inpatient and ambulatory surgery data.
Covariates
We included individual sociodemographic characteristics along with health/disease predispositions to adjust for potential confounding of the relationship between neighbourhood environments and adult chronic disease. Covariates included age (years), sex (male/female), marital status (married vs divorced/single), non-White race, ethnicity and education (less than high school, high school, some college, college or greater). We used education information appearing on the Utah birth certificates of their children (if any).
Zip code characteristics
We used zip code boundaries as a working definition of neighbourhoods. To examine how Google-derived neighbourhood variables relate to more traditional neighbourhood variables, we merged our image dataset with 5-year estimates (2011–2015) from the American Community Survey which comprised the following zip code-level characteristics: population density, percentage of the population 65 years and older, percentage of Hispanics, percentage of blacks, median household income and percentage of householder living in current residence for 5 or more years. We investigated property values as a covariate but excluded it from the model because it was highly correlated (r=0.93) with median household income.
Analytic approach
Choropleth maps were created using ArcGIS Desktop software (ESRI) and the 2016 U.S. Census TIGER/Line Shapefiles. We used tertile breaks in displaying spatial data patterns. A one-to-many spatial join was performed with the image locations and zip codes in order to aggregate the image results into geographical areas. We implemented adjusted linear regression models to examine associations between area-level built environment characteristics and other area-level characteristics (ie, demographics and economic characteristics). To examine the relationship between built environment characteristics and individual-level health outcomes, we merged administrative and medical records from the Utah Population Database to zip code summaries of built environment characteristics. We implemented log Poisson regression models to estimate prevalence ratios (95% CIs) representing associations between tertiles of built environment characteristics and individual chronic disease prevalence. SEs were adjusted for clustering of values at the zip code level. Statistical analyses were implemented with Stata MP V.13 (Stata).
Results
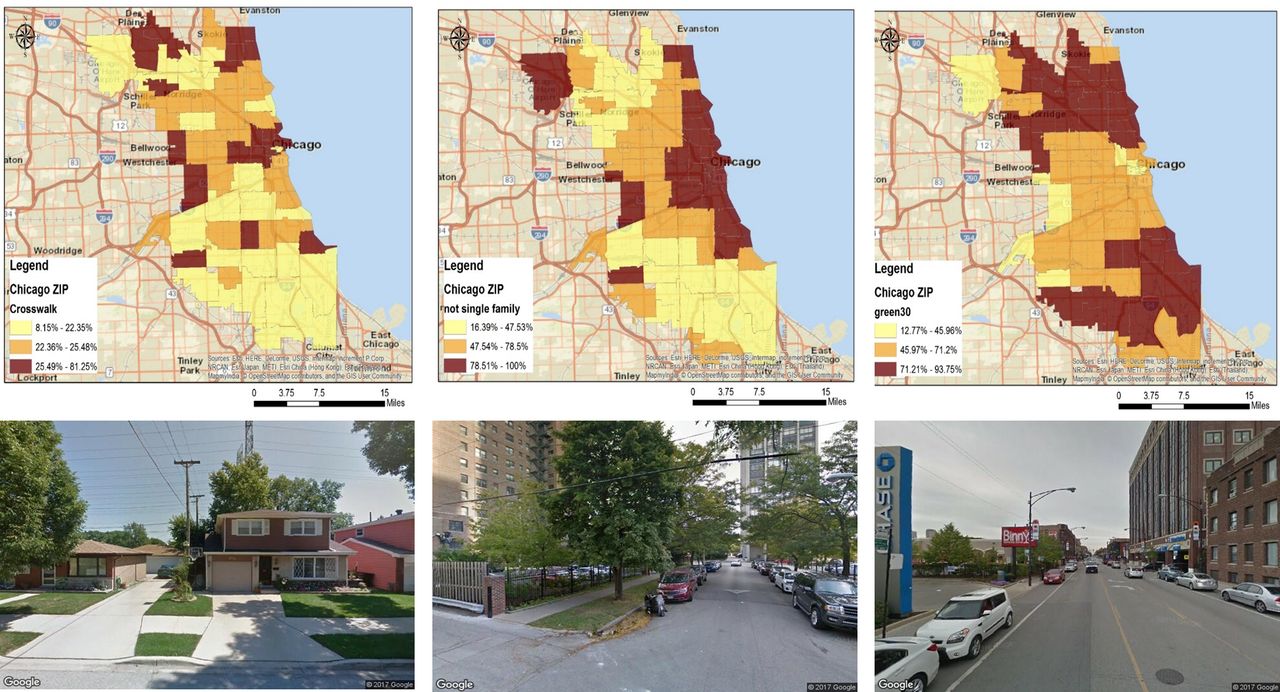
There was much variation in the built environment characteristics across the three cities (table 1). Charleston had the highest percentage of green streets (79%), while Chicago had the highest percentage of streets with crosswalks (23%) and commercial buildings/apartments (56%). Figures 1–3 display the zip code distribution of the three built environment characteristics in the three cities as well as sample street view images. (Note: full-page figures are also reproduced in the online supplemental files, Figures S1–S9). In Salt Lake City, crosswalks were most common in central regions, commercial buildings/apartments were found in high density in a few small areas and street greenness was abundant in the eastern region. In Chicago, crosswalks and commercial buildings/apartments were prevalent across the city, with somewhat lower percentages for the most southern areas. In Chicago, green space was prominent in the most northern and southern areas. In Charleston, crosswalks and green space could be found across the region, while commercial buildings/apartments were concentrated in the south-western region.
Supplementary file 1
Descriptive characteristics of neighbourhood characteristics

Zip code distribution of built environment characteristics in Salt Lake City, Utah. For each zip code, the following was calculated: percentage of street images with (A) presence of a crosswalk, (B) building type other than a single-family detached house and (C) street landscaping comprising at least 30% of the image. Neighbourhood characteristics were categorised into tertiles and spatially mapped. Darker colours represent higher tertile values. Data source: Google Street View images.

Zip code distribution of built environment characteristics in Chicago, Illinois. For each zip code, the following was calculated: percentage of street images with (A) presence of a crosswalk, (B) building type other than a single-family detached house and (C) street landscaping comprising at least 30% of the image. Neighbourhood characteristics were categorised into tertiles and spatially mapped. Darker colours represent higher tertile values. Data source: Google Street View images.

Zip code distribution of built environment characteristics in Charleston, West Virginia. For each zip code, the following was calculated: percentage of street images with (A) presence of a crosswalk, (B) building type other than a single-family detached house and (C) street landscaping comprising at least 30% of the image. Neighbourhood characteristics were categorised into tertiles and spatially mapped. Darker colours represent higher tertile values. Data source: Google Street View images.
In Salt Lake City, greater population density was marginally related to fewer commercial buildings/apartments and more green streets (see online supplemental table S1). Areas with more senior citizens had more green streets in Salt Lake City. Percentage of blacks was correlated with more crosswalks and more commercial buildings/apartments. Percentage of Hispanics was correlated with fewer crosswalks and fewer commercial buildings/apartments (online supplemental table S1). In Chicago, zip codes with more seniors and higher median household income had greener streets and fewer commercial buildings/apartments (online supplemental table S2). In Charleston, population density was negatively associated with green streets. Zip codes with higher population density and higher percentage of young residents were less likely to have commercial buildings/apartments. Percentage of blacks was related to more commercial buildings/apartments and marginally more crosswalks (see online supplemental table S3). Analyses examining relationships at the census tract level generally showed similar associations as seen at the zip code level (online supplemental tables S4–S6), although at the tract level, it becomes more apparent that higher median household income was associated with more green streets and fewer commercial buildings/apartments.
Merging built environment indicators in Salt Lake City with individual-level health outcomes from the Utah Population Database, we examined the potential influences of neighbourhood characteristics on adult obesity and diabetes. Comparing the third tertile with the first tertile, more green streets (prevalence ratio (PR)=0.73; 95% CI 0.63 to 0.85), crosswalks (PR=0.76; 95% CI 0.69 to 0.85) and presence of commercial buildings/apartments (PR=0.79; 95% CI 0.67 to 0.94) were associated with lower individual obesity prevalence (table 2). More green streets (PR=0.86; 95% CI 0.77 to 0.96), crosswalks (PR=0.87; 95% CI 0.80 to 0.95) and presence of commercial buildings/apartments (PR=0.81; 95% CI 0.67 to 0.98) were also associated with lower individual diabetes prevalence (table 2). In sensitivity analyses, we adjust for birth weight, a predisposing factor for obesity and diabetes.25 26 Results were qualitatively similar (online supplemental table S7), but the sample size was smaller because analyses used only adults born in Utah. Analyses using continuous BMI also suggest that green streets and crosswalks were related to lower BMI (online supplemental table S8).
Built environment predictors of adult obesity and diabetes,* Salt Lake City
Discussion
In this study, we demonstrate the feasibility and accuracy of computer vision models for automatic detection and characterisation of neighbourhood built environment features. Moreover, in piloting our algorithms across three visually and geographically distinct US cities, we found that the models were generally robust to varying landscapes. Group demographic characteristics correlated with built environment features, either suggesting differential access or preference for different types of neighbourhoods. Greater median family income was related to greener streets and fewer commercial buildings/apartments. In Chicago, greater population density was related to more commercial buildings/apartments, but in Charleston and Salt Lake City, the opposite was true, and suggested different forms of dominant housing and building types for more populous areas. Furthermore, in Salt Lake City, we found that green streets, crosswalks and commercial buildings/apartments were associated with lower individual prevalence of obesity and diabetes, controlling for predisposing characteristics.
Study findings in context
Previous studies have used Google Street View to perform virtual audits to assess walkability,27 physical disorder,28 retail alcohol stores29 and urban greenery30 among other neighbourhood characteristics. Researchers have also developed a Computer Assisted Neighborhood Visual Assessment System to allow users to conduct virtual neighbourhood audits of Google Street View images.31 Studies comparing the results of onsite audits and virtual audits have found good agreement across a range of measures.32 33 A study of 37 block faces in New York City found high levels of agreement for pedestrian safety, motorised traffic, parking and infrastructure. Assessment for physical disorder and neighbourhood characteristics that had fine details or temporal variability had lower levels of agreement.34
Moreover, research teams have begun to use automated approaches to extract neighbourhood features from Google Street View images such as pedestrian count35 and visual enclosure (ie, proportion sky visible from a point on the street)36—measures associated with walkability. In this paper, we use street view images to extract additional neighbourhood characteristics and investigate their associations with chronic disease. Our findings are consistent with prior literature. Mix land uses, connected streets, higher residential density and attractive scenery promote physical activity.37–39
Study strengths and limitations
The neighbourhood built environment can impact health and health behaviours by locating either risks or resources for health. Thus far, characterising and investigating built environment features has generally been limited to local studies due to the resource-intensive nature of (1) site visits to create community inventories of features and (2) manual annotations of street images. In this study, we leveraged recent advancements in computer vision and the emergence of massive sources of street image data. We developed a data collection strategy using geographic information systems to assemble a collection of street intersection and street segment images for three cities in the USA. We implemented computer vision algorithms to produce neighbourhood summaries of built environment that have been theoretically and empirically identified to be important for health outcomes. We then investigated the potential impact of neighbourhood environments on chronic diseases using administrative records and medical records from a large healthcare provider, accounting for predisposing characteristics.
Nonetheless, our study has limitations. Like other modes of data collection, image data can only capture a subset of community features. For instance, we are unable to create indicators for noise (eg, hearing gunshots) and witnessing criminal activity. Even when the goal is a built environment characteristic, not all types of characteristics lend themselves to easy extraction from images and processing by computer vision algorithms. In preliminary analyses, we attempted to construct indicators of litter, but manual annotations of street images had low reliability between raters given the small size of litter and its resemblance to other small objects such as leaves. We also had difficulty obtaining enough training data for dilapidated buildings and graffiti because of their relative rarity. Ratings of neighbourhood aesthetics (‘beauty’) varied greatly between raters. Characterising subjective qualities of a neighbourhood may require amassing resident and visitor perceptions to capture variability. César Hidalgo, Ramesh Raskar and colleagues used crowd-sourcing techniques to obtain labelled data on perceived safety of street views from cities across the USA and from these labelled data, they built machine learning algorithms to predict how safe the street image looks to a human observer.40
Besides the type of neighbourhood features that can easily lend themselves to automatic extraction via computer vision models, the depth of neighbourhood features that can be extracted may be limited. Neighbourhood inventories created from onsite visits provide a wealth of fine-grain information about hundreds of different features. Building a computer vision model to accurately extract each of these hundreds of features would be a difficult task. Well-known neighbourhood audit instruments include the Irvine-Minnesota Inventory,41 the Pedestrian Environment Data Scan42 and the Maryland Inventory of Urban Design Qualities.43
Another limitation was that analyses were cross-sectional, and thus the study was unable to evaluate longitudinal trends. The analyses did not take into account residential histories and the length of time individuals lived in the communities. We find links between built environment characteristics and chronic disease prevalence; however, our study was unable to identify the direction of causality. For instance, study participants’ chronic disease diagnoses may have preceded their time in a neighbourhood or their diagnoses may have prompted them to move into a different neighbourhood.
Conclusions
The epidemic rise in chronic health conditions is recent. This suggests that its cause is social, cultural and constructed rather than purely biological. Nonetheless, the dearth of data on contextual factors limits understanding of the influence of neighbourhood characteristics on health. We harness the underused potential of street image data to characterise built environments. Our substantive investigation of the impact of built neighbourhood characteristics on chronic conditions suggests that green streets, crosswalks and mix building types were related to lower obesity and diabetes prevalence. Results and data products can be used by city agencies and public health practitioners to inform strategies for improving community health.
What is already known on this subject
Neighbourhood characteristics have been associated with mental and physical health outcomes including chronic disease. However, the bulk of the literature has focused on small geographical locations due to the time and cost demands of neighbourhood audits of built environment characteristics.
What this study adds
In this study, we demonstrate the feasibility and accuracy of computer vision models for the automatic detection and characterisation of neighbourhood built environment features across three visually and geographically distinct cities. Investigating health outcomes in Salt Lake City, we found that green streets, crosswalks and commercial buildings/apartments were associated with lower individual obesity and diabetes prevalence, controlling for individual-level and zip code-level predisposing characteristics.
Acknowledgments
We thank Dr James VanDerslice and Heidi Hanson for their guidance on the project.
References
Footnotes
Contributors QCN took the lead in designing the study, implementing analyses and writing the manuscript. MS and TT devised and implemented computer vision approaches to process the Google Street View images. MM and MP obtained Google Street View images via the Google Street View API, mapped the data and edited the manuscript. TXN, WY, H-WM, MW, FL, KRS and KB assisted with the design of the study and edited the manuscript.
Funding This work was supported by NIH grants 5K01ES025433 and 3K01ES025433-03S1 (Dr Nguyen, PI).
Competing interests None declared.
Patient consent Our study involved analyses of de-identified records.
Ethics approval The University of Utah Institutional Review Board approved the study.
Provenance and peer review Not commissioned; externally peer reviewed.
Data sharing statement Zip code and census tract level indicators of the built environment indicators developed for this manuscript can be downloaded at our project website: https://hashtaghealth.github.io/geoportal/start.html