Article Text

Abstract
Background The contribution of increasing numbers of deaths from suicide, alcohol-related and drug-related causes to changes in overall mortality rates has been highlighted in various countries. In Scotland, particular vulnerable cohorts have been shown to be most at risk; however, it is unclear to what extent this applies elsewhere in Britain. The aim here was to compare mortality rates for different birth cohorts between Scotland and England and Wales (E&W), including key cities.
Methods Mortality and population data (1981–2017) for Scotland, E&W and 10 cities were obtained from national statistical agencies. Ten-year birth cohorts and cohort-specific mortality rates (by age of death, sex, cause) were derived and compared between countries and cities.
Results Similarities were observed between countries and cities in terms of peak ages of death, and the cohorts with the highest death rates. However, cohort-specific rates were notably higher in Scotland, particularly for alcohol-related and drug-related deaths. Across countries and cities, those born in 1965–1974 and 1975–1984 had the highest drug-related mortality rates (peak age at death: 30–34 years); the 1965–1974 birth cohort also had the highest male suicide rate (peak age: 40–44 years). For alcohol-related causes, the highest rates were among earlier cohorts (1935–1944, 1945–1954, 1955–1964)—peak age 60–64 years.
Conclusions The overall similarities suggest common underlying influences across Britain; however, their effects have been greatest in Scotland, confirming greater vulnerability among that population. In addressing the socioeconomic drivers of deaths from these causes, the cohorts identified here as being at greatest risk require particular attention.
- mortality
- alcoholism
- drug and narcotic control
- suicide
Data availability statement
All data relevant to the study are included in the article or uploaded as supplemental information. No additional data are available. The analysed data presented in the paper are not publicly available. However, the data on which the analyses were based can be requested from the national statistical agencies listed in the manuscript.
This is an open access article distributed in accordance with the Creative Commons Attribution Non Commercial (CC BY-NC 4.0) license, which permits others to distribute, remix, adapt, build upon this work non-commercially, and license their derivative works on different terms, provided the original work is properly cited, appropriate credit is given, any changes made indicated, and the use is non-commercial. See: http://creativecommons.org/licenses/by-nc/4.0/.
Statistics from Altmetric.com
Introduction
The higher levels of mortality in Scotland compared with the rest of Western Europe, including other UK nations, are well evidenced.1 2 The country’s relative mortality position has worsened since the early 1980s, with increasing numbers of deaths from suicide, alcohol-related and drug-related causes a contributory factor.1–3 Worrying recent trends in these causes of death have been observed in other countries, most notably the USA,4 5 grouped under the heading ‘diseases of despair’, highlighting their underlying social—particularly socioeconomic—influences: ‘the causes of the causes’.6 7 Such influences have been highlighted in previous analyses of Scottish trends. For drug-related deaths and suicide, cohort effects have been noted, with evidence of increasing trends being driven by particular groups of vulnerable, socioeconomically deprived, individuals—particularly men—in response to the well-documented changes in the social, economic and political context of the 1980s.8 9 For alcohol, a more complex age–period effect was observed, with older working-age adults in the 1990s and 2000s particularly affected10—although analysis of deaths in Scotland’s largest city, Glasgow, also identified younger cohorts at higher risk of such harm.11 With the exception of suicide,12 no comparative analyses of such effects have been undertaken with other UK nations (and the suicide study was based on comparisons with English and Welsh data that are now 20 years out of date): thus it is not clear if the effects observed in Scotland have also occurred elsewhere. The aim of this study was to compare mortality rates for these causes for different birth cohorts between Scotland and England and Wales (E&W). Given the importance of urban populations to national health outcomes,13 we also undertook similar analyses for selected UK cities.
Methods
Mortality and population data
Numbers of deaths from suicide (including events of undetermined intent), alcohol-related causes and drug-related poisonings were obtained for Scotland from the National Records of Scotland, and for E&W from the Office for National Statistics. The data covered the period 1981–2017 and included: year of death; underlying cause; single year of age; sex and city. The three causes of death were defined by the International Classification of Diseases, 9th Revision (ICD9) and 10th Revision (ICD10) codes: the full list of codes are shown in online supplemental table 1.
Supplemental material
Matching population data by year, single year of age (0–89 years) and sex for the countries and cities were obtained from the same national statistical agencies. For the English cities for the years 1981–1990, only data for 5-year age bands (rather than single year of age) were available: estimates for single year of age were therefore derived, based on the distribution of single years within each 5-year age group in each individual city, by sex, in 1991.
Geography
The main analyses compared Scotland with E&W (combined). With the exception of London (excluded because its size and ethnic diversity can make meaningful city-level comparisons problematic,14 the largest cities in each country were selected: Glasgow, Edinburgh, Dundee and Aberdeen in Scotland; Liverpool, Manchester, Birmingham, Leeds, Sheffield and Bristol in England. All cities were defined by current local authority boundaries and assigned to the data at source by the national statistical agencies.
Statistical analyses
To provide context for the main analyses, trends in European age-standardised rates were calculated (for all ages, by sex, cause and country) for the three causes of death, using the 2013 European Standard Population,15 and presented as 3-year rolling averages.
For the main analyses, following the methods employed in previous analyses,8 9 11 we derived 10-year birth cohorts from the data. For the mortality data, year of birth was calculated as year of death minus age; corresponding population denominator data were derived in a similar manner. Birth cohorts were defined as those born in 1885–1894, 1895–1904… up to 2005–2014. Crude mortality rates per 100 000 population—that is, the proportion of individuals born in each period who have died—were calculated and analysed by age at death (in 5-year age bands), sex, city and country. For some city-level analyses, we additionally calculated rates for both sexes combined in order to address the issue of small numbers: interpretation of the results for smaller populations can be problematic at that level of stratification (particularly for the causes of death included in this study). Results are presented graphically using bar charts, focusing on deaths at age 25 years and above (thus excluding cohorts born after 1994). For comparison, country-level analyses for all-cause deaths were also undertaken.
In addition, to confirm any observed differences between the mortality rates of equivalent birth cohorts in Scotland and those in E&W, we ran a series of negative binomial regression models (using the glm.nb function in the R package MASS).16 Separate, sex-specific, models were run for each of the three causes of death. In each model, the independent variables were age group, birth cohort, and an interaction term of birth cohort and country of residence. Further methodological details are included in online supplemental table 2 in the online appendix. Models were run for the country-level analyses only, given the problematic issue of small numbers at city level alluded to earlier.
Results
Figure 1 presents age-standardised mortality rates for the three causes of death that are the focus of the study. These trends have been described previously elsewhere,3 but can be briefly summarised as follows. For all three causes, male and female rates have generally been higher in Scotland than in E&W over the whole period (strikingly so in the case of alcohol-related and drug-related deaths). Alcohol-related mortality rates increased dramatically in Scotland between the start of the 1990s and early 2000s, and declined thereafter (although they increased again recently); similar, but less striking, trends occurred in E&W. Male deaths from drug-related poisonings increased over most of the period in Scotland, starting in the mid-to-late-1980s; in E&W rates also increased in the 1990s and early 2010s, but declined in-between those periods. Among women, previously flat (Scotland) or falling (E&W) rates started to increase from the mid-to-late-2000s. For suicides, a downward trend in male rates has been observed in E&W over most of the period; in contrast, rates in Scotland increased between the start of the 1980s and early 2000s and declined thereafter. Female rates have declined in both settings, but to a greater degree in E&W.

European age-standardised mortality rates (EASRs) per 100 000 population, 3-year rolling averages, for (A) alcohol-related causes, (B) drug-related poisonings and (C) suicide, Scotland and England and Wales, 1981–2017.
Online supplemental figure 1 acts as a guide to the presentation of the main results below. It shows analysis of all-cause deaths in E&W—in this example for women. Each vertical bar represents a different birth cohort, with the horizontal blue bars showing the average mortality rate across all birth cohorts by age at death: thus we see that for all causes of death, overall mortality rates rise with age (peaking in the oldest age group), and that for every age group, the mortality rate of each birth cohort has been lower than the preceding cohort.
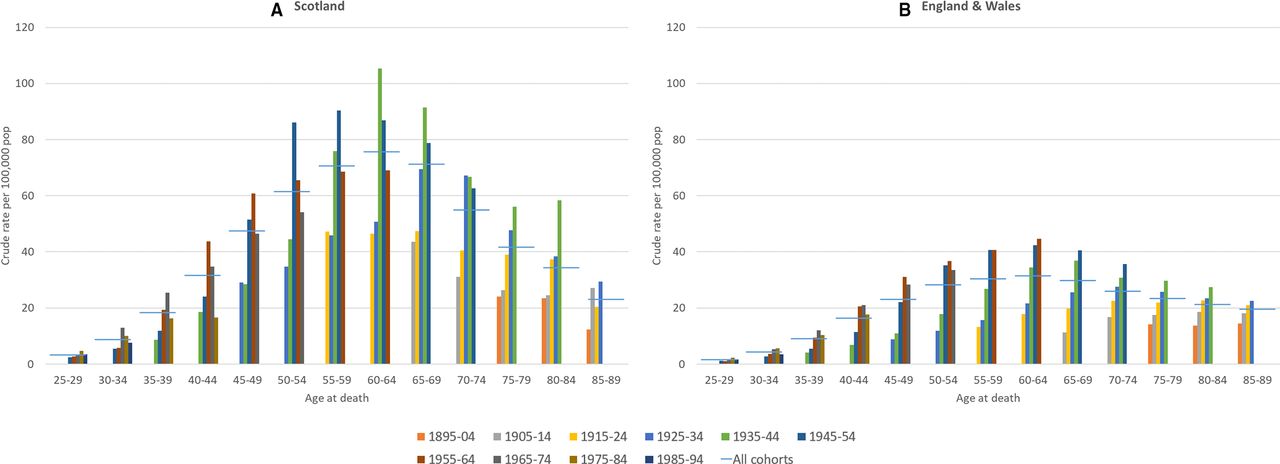
In contrast to those all-cause analyses, figure 2 shows similar data for alcohol-related causes of death, comparing the mortality rates of male birth cohorts in Scotland with those in E&W. A number of points are noteworthy. First, in contrast to all-cause deaths, overall alcohol-related mortality rates (the blue horizontal bars) peak at age 60–64 years, declining thereafter; this is true in both Scotland and E&W. Second, unlike for all-cause deaths, many of the later birth cohorts have higher alcohol-related mortality rates than preceding cohorts. In E&W, this is true for deaths at age 55–59 years and above; however, the pattern is much more complex in Scotland. Third, although there are some similarities between the countries in terms of the overall pattern and the cohorts with the highest death rates—namely the 1935–1944, 1945–1954 and 1955–1964 cohorts—the scale of mortality across the different cohorts in Scotland is much higher than that for E&W, particularly from age 45–49 years and above. The 1935–1944 and 1945–1954 cohorts in Scotland have notably higher death rates, and at their peak age (50–69 years), the rates are two to three times higher than those of equivalent cohorts in E&W. For example, at age 60–64 years, the mortality rate of the Scottish 1935–1944 birth cohort is 105.3 per 100 000; the rate for the equivalent E&W cohort is 34.4. Equivalent data for women are presented in online supplemental figure 2 in the online appendix: these show very similar overall patterns, but with lower associated mortality rates.

Alcohol-related mortality: crude rates per 100 000 population by 10-year birth cohort, men, (A) Scotland and (B) England and Wales, 1981–2017.
Figure 3 presents alcohol-related mortality rates for Glasgow and two similarly deprived17 English cities, Liverpool and Manchester, and—for comparison—a less-deprived18 northern English city, Sheffield. To partially overcome the issue of small numbers at city level (as previously discussed), and given the similarity of results for men and women shown in figure 2 and online supplemental figure 2, data for men and women have been combined. Reflecting the national comparisons, rates across birth cohorts in Glasgow are markedly higher than in the English cities (for example, rates of 50.0, 56.7 and 163.6 per 100 000 in Liverpool, Manchester and Glasgow, respectively, for the 1935–1944 cohort at 60–64 years); however, the same is also true of rates in Liverpool and Manchester compared with Sheffield (24.7 per 100 000 for the example above). More generally, the same cohort/age patterns that were observed at the national level are also seen across these cities.

Alcohol-related mortality: crude rates per 100 000 population by 10-year birth cohort, both sexes, Glasgow, Liverpool, Manchester, Sheffield, 1981–2017.
Figure 4 (men) and online supplemental figure 3 (women) show deaths from drug-related poisonings for Scotland and E&W. For men, although there are some similarities between Scotland and E&W in overall patterning, with the same peak age at death across cohorts (30–34 years, shown by the blue horizontal line) and the same cohorts most affected (especially 1975–1984 and 1965–1974), differences in rates between countries for these cohorts are striking. For example, the proportion of the 1975–1984 cohort dying at age 40–44 years in Scotland is almost four times that of the equivalent cohort in E&W (crude mortality rates of 88.0 and 23.5 per 100 000 population, respectively). For women, similar differences in scale between Scotland and E&W are evident for deaths at younger ages (<55 years): for example, the crude mortality rate at age 40–44 years for the 1975–1984 cohort is approximately five times higher in Scotland (38.9 compared with 7.9 per 100 000).

Deaths from drug-related poisonings: crude rates per 100 000 population by 10-year birth cohort, men, (A) Scotland and (B) England and Wales, 1981–2017.
Similar data for drug-related poisonings for both sexes combined, and limited (for clarity of interpretation) to the peak mortality ages of <55 years, are shown for each city in the online appendix (online supplemental figure 4 and 5). The 1965–1974 and (especially) 1975–1984 cohorts stand out in most cities, with the rates generally highest for the latter cohort (with Manchester a partial exception). There is notable variation in rates across the English cities; however, the rates in the Scottish cities (especially in Dundee and Aberdeen for the 1975–1984 cohort at age 40–44 years) are many times higher. For example, the rate in Dundee for that cohort and that age is 176.4 per 100 000; the highest equivalent rate among the English cities is 55.7 in Liverpool. Note that (again, for ease of interpretation) the two sets of charts are shown on different y-axis scales.
Figure 5 compares cohort-specific mortality rates for suicide between Scotland and E&W for men and women. For men, the overall pattern—including the peak age at death (40–44 years) and the cohort with the highest mortality rates at younger ages (1965–1974)—is broadly similar in both Scotland and E&W. However, in Scotland the mortality rates of that cohort are higher (39.6 compared with 23.1), and the extent to which they differ from the other cohorts is greater than for E&W. For women, the peak age of death is slightly higher, and earlier cohorts (eg, 1915–1924 and 1925–1934) have the highest rates: this is true of Scotland and E&W. However, there are again differences between the countries: rates at younger ages are lower in E&W, and the pattern of declining mortality rates across successive later cohorts at most age groups which is observed there is not replicated in Scotland, where the picture is much less clear. Data at city level are difficult to interpret because of small numbers, and the different male and female patterns shown above mean that combining data for the sexes is unhelpful; thus, city data are not shown.

Suicide (including deaths from undetermined intent): crude rates per 100 000 population by 10-year birth cohort, males (top) and females (bottom) for (A) Scotland and (B) England and Wales, 1981–2017.
Finally, online supplemental table 2 in the online appendix presents the results of the negative binomial regression analyses. For drug-related poisonings and suicide, this confirms and further quantifies the difference in rates between key birth cohorts in Scotland and E&W, as described above. For example, among men, for drug-related poisonings the regression coefficient for the country—1975–1984 birth cohort interaction is 0.70 (p<0.01), and for suicide the younger cohorts (1965–1974, 1975–1984 and 1985–1994) are all similarly highlighted in the results (p<0.01). For alcohol-related deaths, however, the results suggest that in terms of actually predicting differences in the observed rates shown in figure 2 (and online supplemental figure 2), age group may be a more important explanatory factor than birth cohort. These results are discussed further below.
Discussion
Overall findings and implications
We analysed mortality rates by birth cohort for three important, and socially determined, causes of death over an approximately 35-year period. Comparing Scotland with E&W, broad similarities were observed in terms of the peak ages of death across cohorts, and the cohorts associated with the highest death rates. For drug-related poisonings, those born in 1965–1974 and 1975–1984 had the highest mortality rates (with peak age of death being 30–34 years), while the 1965–1974 cohort also had the highest suicide rate among men (peak age: 40–44 years). For alcohol-related causes, earlier cohorts (1935–1944, 1945–1954 and 1955–1964) had the highest rates of death, and the peak age at death was correspondingly higher at 60–64 years. However, there were profound differences between the countries in terms of the scale of mortality, with rates strikingly higher in Scotland, particularly for alcohol-related and drug-related deaths. This suggests that similar underlying influences on mortality have operated across all the countries, but that their effects have been greatest in Scotland. This tallies with previous research suggesting a greater vulnerability to these influences in Scotland.19 20 The analyses have additionally identified certain cohorts at greater risk of death in particular cities, as well as other variations in rates which may be attributable to particular local influences. These have potential implications for local policymakers and may be worthy of further research. Such further work would also be enhanced by a greater focus on the socioeconomic circumstances of the cohorts most affected, either through the use of historical area-based deprivation data21 or, ideally, by means of cohort analyses of comparable UK longitudinal data sets.
Strengths and weaknesses
The key strength of the study is that this is the first time that potential cohort effects on mortality have been compared between Scotland and E&W for alcohol-related and drug-related deaths. In addition, similar comparisons for suicide have been based on much more up-to-date data. The analyses are based on over 35 years of death information, and have been undertaken at city, as well as country level. While analysis based on so many years of data is an important strength, it potentially also masks period effects. An additional, and important, weakness is the lack of stratification or adjustment by socioeconomic deprivation, given its importance in explaining differences in mortality rates for these causes. In addition, analyses at city level (when stratified by age, sex and birth cohort) are problematic because of the resulting small numbers of deaths, especially for smaller urban areas. Finally, it should be noted that the definition of drug-related poisonings employed in this study is a broader, less accurate, definition than that employed in official publications of drug-related deaths in the UK (although numbers of deaths are nonetheless broadly similar3).
Relevance to other studies
A large body of work published in recent years has set out the most likely explanation for the much higher mortality observed in Scotland (including its largest city, Glasgow) compared with elsewhere in the UK, including notably higher rates of death from the three causes examined here.19 20 The explanation is complex and multifactorial, but principally relates to a toxic combination of adverse historical living conditions and waves of detrimental national and local government policymaking which have resulted in a greater vulnerability of the population to the effects of other, well-understood, political and socioeconomic determinants of health. The notion of vulnerability has been increasingly used in population health research,13 22–25 and its importance has been particularly emphasised in a number of relevant studies of cohort effects on mortality. For example, Parkinson et al demonstrated that a cohort effect was apparent in relation to the increase in rates of drug-related deaths in Scotland, with vulnerable men living in the most deprived neighbourhoods born between 1960 and 1980 (particularly in the early to mid-1970s) at greatest risk of death8: this is consistent with our own analyses. The same vulnerable cohort was also shown to be at greater risk of suicide in a similar study by the same authors, in which they also showed that the peak age of suicide fell around 1990 from approximately 50–30 years of age. For E&W, Gunnell et al analysed data over a much earlier period, 1950–1999, and showed that successive male cohorts born after 1940 had higher suicide rates than previous cohorts.26 Our analyses of a much more recent period show a slightly different picture: at the peak ages of death for this cause (25–54 years), successive cohorts do have higher risks of suicide until those born in 1965–1974—but the later cohorts (1975–1984 and 1985–1994) have lower rates. A similar pattern is observed in Scotland although, as stated, mortality is higher among all birth cohorts compared with E&W.
In relation to alcohol harm, combinations of price, availability and ‘socioeconomic vulnerability’ have previously been identified as key explanations for changing trends in Scotland.10 27 As with suicide and drugs harm, this socioeconomic vulnerability relates to adults living in socioeconomically deprived neighbourhoods, with the lagged effect of 1980s’ political changes a likely influence. Echoing our own findings, adults in their late 50s and 60s were most affected in terms of age of death. However, the authors suggested there was more evidence of an age–period interaction effect, rather than birth cohort effects: this tallies with the results of the regression analyses undertaken here which also suggest that age may be a better predictor of variation in mortality rates than birth cohort. Another study highlighted concerning mortality rates among women born in the 1970s in the cities of Liverpool, Manchester and Glasgow11: similar results were noted in this study, although the actual numbers of deaths was relatively small, making meaningful interpretation of the rates difficult (and, thus, the results are not shown here).
The policy implications of this work are complex. Much is already known about what should be done to tackle drugs harm in Scotland, helpfully summarised in a recent UK Government Parliamentary Committee enquiry.28 However, the committee’s key recommendations (including the introduction of safe consumption facilities, adopting a public health—rather than criminal justice—approach, decriminalising drugs for personal use, declaring the issue a ‘public health emergency’) were all subsequently rejected by the UK government.29 For alcohol harm, the analyses presented here predate the implementation in 2018 of minimum unit pricing in Scotland,30 while various suicide prevention strategies have been in place in Scotland, E&W for many years31–35 and as noted here, rates have been decreasing across the countries. The policy context is made more complex in terms of both the likely, but as yet unquantifiable, effects of the COVID-19-related economic ‘lockdown’ and imminent recession, as well as the (pre-COVID-19) changes in mortality rates (including increasing death rates among the poorest populations of the UK)36–38 largely attributed to the effects of recent UK government’s ‘austerity’ policies since 2010.39 40 However, all three causes of death are profoundly socioeconomically patterned: thus, frequently articulated recommendations to address the fundamental socioeconomic causes of inequalities in such outcomes clearly apply.41–43 In doing so, particular attention should be paid to the birth cohorts highlighted in these analyses that are at greatest risk.
What is already known on this subject
Death rates from suicide and alcohol-related and drug-related deaths have increased across a number of countries in recent decades.
In Scotland, vulnerable cohorts of socioeconomically deprived adults have been shown to be a greater risk, with responses to the social and political changes of the 1980s important.
What this study adds
For the first time, we compare alcohol-related and drug-related mortality rates of birth cohorts between Scotland and England and Wales (and we update comparisons for suicide).
There are important similarities between the countries in terms of the cohorts at most risk, suggesting similar root causes.
We identify cohorts at greatest risk of mortality at country and city level.
We show cohort-specific mortality rates to be notably higher in Scotland, especially for drug-related and alcohol-related deaths.
Data availability statement
All data relevant to the study are included in the article or uploaded as supplemental information. No additional data are available. The analysed data presented in the paper are not publicly available. However, the data on which the analyses were based can be requested from the national statistical agencies listed in the manuscript.
Ethics statements
Patient consent for publication
Acknowledgments
We are grateful to the various individuals and organisations who supplied the required data: National Records of Scotland (NRS) and the Office for National Statistics (ONS).
References
Supplementary materials
Supplementary Data
This web only file has been produced by the BMJ Publishing Group from an electronic file supplied by the author(s) and has not been edited for content.
Footnotes
Twitter @gerrymccartney1
Contributors DW originally conceived the study. The research questions and analysis plan were agreed by all authors (DW, GM, JM, JP, DS and BW). DW and JM undertook the analyses and drafted the manuscript. All authors provided substantial critical input to improve the manuscript and all authors approved the final draft.
Funding The authors have not declared a specific grant for this research from any funding agency in the public, commercial or not-for-profit sectors.
Competing interests None declared.
Provenance and peer review Not commissioned; externally peer reviewed.
Supplemental material This content has been supplied by the author(s). It has not been vetted by BMJ Publishing Group Limited (BMJ) and may not have been peer-reviewed. Any opinions or recommendations discussed are solely those of the author(s) and are not endorsed by BMJ. BMJ disclaims all liability and responsibility arising from any reliance placed on the content. Where the content includes any translated material, BMJ does not warrant the accuracy and reliability of the translations (including but not limited to local regulations, clinical guidelines, terminology, drug names and drug dosages), and is not responsible for any error and/or omissions arising from translation and adaptation or otherwise.