Article Text

Abstract
Background There are various maternal prenatal biopsychosocial (BPS) predictors of birth weight, making it difficult to quantify their cumulative relationship.
Methods We studied two birth cohorts: Northern Finland Birth Cohort 1986 (NFBC1986) born in 1985–1986 and the Generation R Study (from the Netherlands) born in 2002–2006. In NFBC1986, we selected variables depicting BPS exposure in association with birth weight and performed factor analysis to derive latent constructs representing the relationship between these variables. In Generation R, the same factors were generated weighted by loadings of NFBC1986. Factor scores from each factor were then allocated into tertiles and added together to calculate a cumulative BPS score. In all cases, we used regression analyses to explore the relationship with birth weight corrected for sex and gestational age and additionally adjusted for other factors.
Results Factor analysis supported a four-factor structure, labelled closely to represent their characteristics as ‘Factor1-BMI’ (body mass index), ‘Factor2-DBP’ (diastolic blood pressure), ‘Factor3-Socioeconomic-Obstetric-Profile’ and ‘Factor4-Parental-Lifestyle’. In both cohorts, ‘Factor1-BMI’ was positively associated with birth weight, whereas other factors showed negative association. ‘Factor3-Socioeconomic-Obstetric-Profile’ and ‘Factor4-Parental-Lifestyle’ had the greatest effect size, explaining 30% of the variation in birth weight. Associations of the factors with birth weight were largely driven by ‘Factor1-BMI’. Graded decrease in birth weight was observed with increasing cumulative BPS score, jointly evaluating four factors in both cohorts.
Conclusion Our study is a proof of concept for maternal prenatal BPS hypothesis, highlighting the components snowball effect on birth weight in two different European birth cohorts.
- Ageing
- Diabetes
- Disability
- Child health
- Maternal health
- Birth defects
- Cardiovascular disease
- Birth weight
- Epidemiology of chronic non communicable diseases
- Life course epidemiology
- Cohort studies
- Biostatistics
This is an open access article distributed in accordance with the Creative Commons Attribution Non Commercial (CC BY-NC 4.0) license, which permits others to distribute, remix, adapt, build upon this work non-commercially, and license their derivative works on different terms, provided the original work is properly cited, appropriate credit is given, any changes made indicated, and the use is non-commercial. See: http://creativecommons.org/licenses/by-nc/4.0/.
Statistics from Altmetric.com
- Ageing
- Diabetes
- Disability
- Child health
- Maternal health
- Birth defects
- Cardiovascular disease
- Birth weight
- Epidemiology of chronic non communicable diseases
- Life course epidemiology
- Cohort studies
- Biostatistics
BACKGROUND
Birth weight is an important health indicator associated with the myriad of somatic and neurodevelopment outcomes in later life.1–4 Several maternal prenatal factors determine unfavourable birth outcomes, particularly low and high birth weight, encompassed by the multidimensional interplay between biological, material and psychosocial measures during pregnancy.5
It is widely acknowledged that a greater understanding and description of the biopsychosocial (BPS) nature of fetal growth, birth weight as its surrogate end-point and the interplay of underlying possible causal factors is essential for advancing clinical and social interventions.6–8 The causal role of biological determinants, such as maternal body mass index (BMI) or blood pressure (BP), is well documented.9 However, multiple maternal prenatal non-biological factors such as the marital status, parity, maternal age, smoking and alcohol use are posited to affect fetal development. These are further compounded by the socioeconomic environment, often defined by education attainment, material assets, income and/or parental occupation.5 Large social inequalities showing striking disparities between and within countries are recurrently cited in birth weight studies.10 11 However, these determinants may not exhibit direct causal effects. These set of non-biological risk factors tend to co-occur with direct and indirect relationships. This follows the Engel’s holistic definition of sickness, affected by multiple dimensions from societal to the molecular level.12
Research on the prenatal interplay between biological and non-biological exposures that compose a BPS background still remain in its infancy in birth weight and other early life studies. This remains an important obstacle for improving prenatal interventions aiming at sustainable fetal growth and its long-term consequences. This may be explained by a lack of scientific consensus on defining these non-biological exposures on the one hand, and the lacking practice for appropriate and reproducible quantification of the risk on the other. Part of the challenge is having no consensus on the definition of psychosocial factors to test the ‘psychosocial hypothesis’.7 Social measures may act as surrogate indicators for the psychological status. For example, lifestyle factors such as smoking and alcohol use are associated with socioeconomic position but may also influence psychological well-being of the mother. According to previous evidence, lower social classes are at higher risk of developing psychological disorders and pregnancy complications, potentially mediated via unhealthy behaviours.13 14 The grouping of the aforementioned non-biological factors as psychosocial, although imperfect, remains the closest overarching umbrella term so far and a widely surrogate for depicting such exposures.
Hence, this study builds on the existing knowledge of multi-fold predictors of birth weight to design a model describing the mutual interplay between maternal BPS factors, and address their cumulative risk on birth weight. We use a systematic methodological approach to quantify the risk and evaluate its reproducibility in two independent European populations differing in years of birth, country, ethnicity and social environment.
METHODS
Study design and participants
Data were derived from two prospective population-based birth cohorts: the Northern Finland Birth Cohort 1986 (NFBC1986) and the Generation R Study. The NFBC1986 is a Caucasian-based Finnish population birth cohort.15 Mothers with expected delivery dates between July 1985 and June 1986 were enrolled in the study and data collection was started on average from the 12th week of gestational age (GA). The cohort included 9362 women with 9432 live births, covering 99% of births in the northernmost provinces of Finland—Lapland and Oulu. A wide range of phenotypic, lifestyle and demographic data was collected through questionnaires, and clinical examinations were carried out during antenatal visits. Paternal data were also collected through questionnaires.
The Generation R Study included pregnant women living in Rotterdam, the Netherlands, with expected delivery dates between April 2002 and January 2006.16 Mother’s enrolment was aimed at GA <18 weeks and measurements were planned at—GA <18 weeks, 18–25 weeks and >25 weeks. Fathers were assessed once during the pregnancy. In total, 8879 mothers were enrolled in the study. The cohort is multi-ethnic, including Dutch/European (58%), Surinamese (9%), Turkish (8%), Moroccan (6%), Cape Verdean (4%), Dutch Antillean (3%) and other ethnicities (12%).
NFBC1986 received ethical approval from Ethics Committee of Northern Ostrobothnia Hospital District (EETTMK: 108/2017) and Oulu University, Faculty of Medicine, Oulu, Finland. Ethical approval for Generation R was obtained from the Medical Ethics Committee of the Erasmus Medical Centre (MEC 198.782/2001/31), Rotterdam, the Netherlands. Both cohorts received ethical approval in accordance with the Declaration of Helsinki 1964. Informed consent was obtained from all individual participants in both cohorts. We excluded twins and children born preterm (<37th week of gestation). In Generation R, if mothers participated with multiple children, only one of these was randomly selected.
Measures
Maternal biological measures (BMI, BP and haemoglobin levels) were recorded through clinical examinations during antenatal visits. Psychosocial measures related to age, marital status, employment history, working position, assets, miscarriages, stillbirths, pregnancy desirability, parity, smoking and alcohol use during pregnancy were gathered through questionnaires. Detailed description of the measures and question responses is provided in online supplementary materials. In addition, paternal data concerning employment history, BMI, smoking and alcohol use were also included.
We used birth weight (g) as an outcome measure and transformed it into SD scores corrected for gestational duration and sex using North-European growth standards.17 The NFBC1986 is older in birth chronology and a homogeneous cohort in contrast to the Generation R Study; hence, it was used as the reference population to build the maternal BPS model which then was tested for feasibility in Generation R.
Identification of maternal BPS model: NFBC1986
Variable selection
Selection of variables was a systematic data-driven approach as described by Lowry et al.18 In NFBC1986, maternal BPS determinants of birth weight were systematically selected based on a priori knowledge, literature and data availability. In the primary analyses, univariate linear regression was done to assess associations between maternal BPS variables and birth weight using SAS (version 9.4, SAS Institute Inc., Cary, NC, USA) and variables showing association (p<0.01) were included in the subsequent analysis.
Factor analysis
Factor analysis was carried out using MPlus 7.0 to construct the BPS model in NFBC1986.19 Exploratory factor analysis (EFA) was used to determine the latent construct among observed variables, followed by confirmatory factor analysis (CFA) to provide the final model. Analysis was conducted using weighted least squares mean and variance adjusted parameter estimates appropriate for categorical variables. Geomin oblique rotations were used to provide correlations between the factors. The observed variables with the negative loadings were reverse coded so that the correlations, and the loadings of the observed variables were all positive within the factor to facilitate interpretation.20 We examined best factorial structure through factor loading patterns, scree plot and eigenvalues. We used root mean square error of approximation (RMSEA), comparative fit index (CFI) and Tucker-Lewis Index (TLI) to assess model fit. Values <0.06 (RMSEA) and >0.90 (CFI and TLI) are suggestive of good model fit.21 22 Variables with factor loadings <0.3 were excluded.
Validation of the maternal BPS model: Generation R Study
Variables similar to the NFBC1986 data were selected in Generation R, and data were harmonised in both cohorts to maintain uniformity. Same latent factor structure was generated in Generation R weighted on the factor loadings of NFBC1986.
Factor scores (continuous values with mean = 0 and SD = 1) for each latent factor were extracted from both cohorts to assess the association with birth weight using regression analyses (Model 1). Stepwise adjustments were performed for each of the other latent factors (Model 2) and additionally for ethnicity in Generation R (Model 3). Finally, factor scores of each factor were divided into tertiles (scored as 0, 1, 2) and added together to calculate a cumulative BPS score, ranging from 0 to 8, which were then tested for associations with birth weight. The latent factors in the cumulative BPS score were included in the direction of association with lower birth weight to maintain consistency. The study design is illustrated in online supplementary figure S1.
Supplemental material
RESULTS
Participant characteristics
Both cohorts had comparable sample size and similar sex distribution. On average, birth weight for gestational was approximately 100 g lower in Generation R compared with NFBC1986. Across the two cohorts, maternal age, educational level, smoking and alcohol use were higher in Generation R, whereas mothers in NFBC1986 were more often multiparous and married (table 1).
Characteristics of the study population in the Northern Finland Birth Cohort 1986 and the Generation R Study, the Netherlands
Variable selection
Twenty-two variables related to BPS measures were included in the NFBC1986. Of these, four, including maternal systolic blood pressure (SBP) at 20 and 30–36 weeks gestation, working position and paternal employment were not singularly associated with birth weight (p>0.05) and were subsequently excluded (figure 1 and online supplementary table S1).

Forest plot showing association between maternal prenatal biopsychosocial observed variables with birth weight, corrected for gestational age and sex in the NFBC1986 (the effect size for birth weight is in SD scores, corrected for gestational age and sex, by unit or category increase in exposure).
Latent factors
In the NFBC1986, an EFA of the remaining 18 variables yielded a four-factor model for 13 variables, without any cross-loadings or low factor loadings of <0.3 and with acceptable model fit (RMSEA = 0.049, CFI = 0.905, TLI = 0.832). The first six factors showed eigenvalue above 1; however, the scree plot showed a sudden dip after factor four, and the first four factors explained 50% of the accumulated percentage of common variance. Thus, a four-factor structure was used based on interpretability, model fit indices and clean structure without cross-loadings (online supplementary table S2, online supplementary figures S2 and S3).
CFA supported the four-factor structure with all indicators loading strongly onto their respective latent factors (figure 2). The latent factors were labelled to closely represent the characteristics of their included observed variables. The first two factors separated to represent biological variables. The first factor was characterised by pre-pregnancy and end-pregnancy BMI and was termed ‘Factor1-BMI’. The second factor included diastolic blood pressure (DBP) at 20 and 30–36 weeks gestation and was termed ‘Factor2-DBP’. The third factor represented a mix of variables related to maternal profile and socioeconomic status (labelled ‘Factor3-Socioeconomic-Obstetric-Profile’), including ‘no previous pregnancy complications’, ‘no house ownership’, ‘null-parity’, ‘lower maternal age’ and ‘unmarried status’. The fourth factor labelled as ‘Factor4-Parental-Lifestyle’, included maternal and paternal smoking and alcohol use. Higher values for ‘Factor3-Socioeconomic-Obstetric-Profile’ and ‘Factor4-Parental-Lifestyle’ represented unhealthier factors. Strongest correlations were observed between ‘Factor1-BMI’ and ‘Factor2-DBP’ in both cohorts, and discrepancy was observed in the correlation between ‘Factor3-Socioeconomic-Obstetric-Profile’ and ‘Factor4-Parental-Lifestyle’ between two cohorts (figure 3).
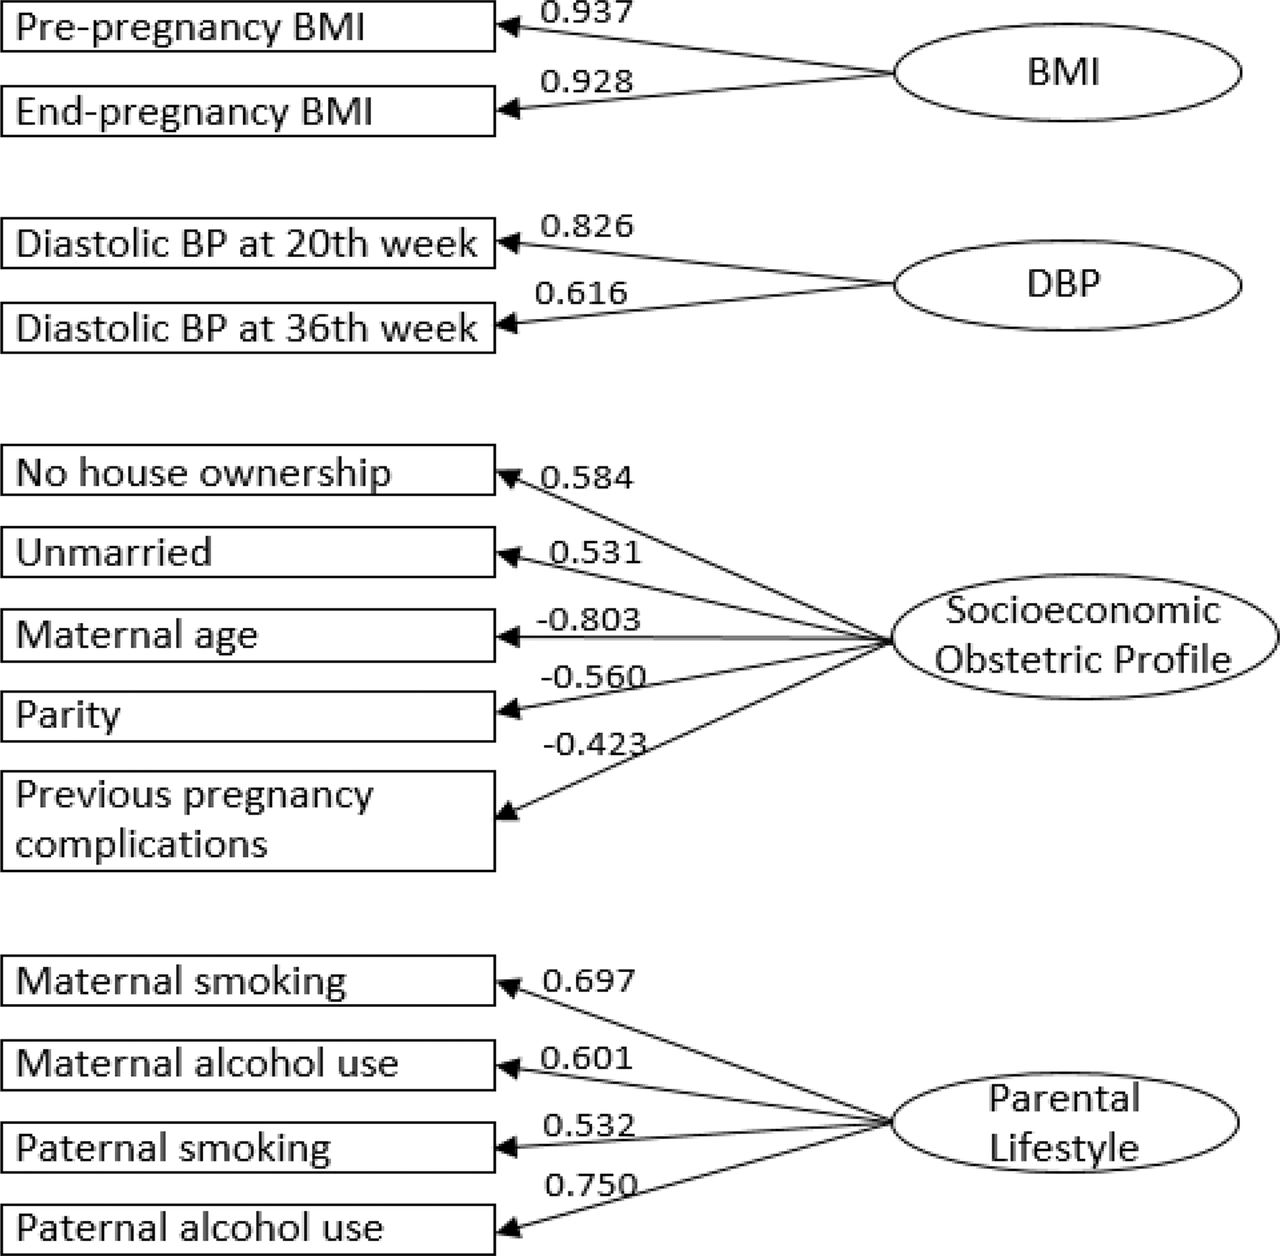
Confirmatory factor analysis of four-factor structure including 13 observed variables in the NFBC1986. NFBC1986, Northern Finland Birth Cohort 1986.

Correlation between four latent factors in the NFBC1986 and the Generation R Study. NFBC1986, Northern Finland Birth Cohort 1986.
Regression analysis
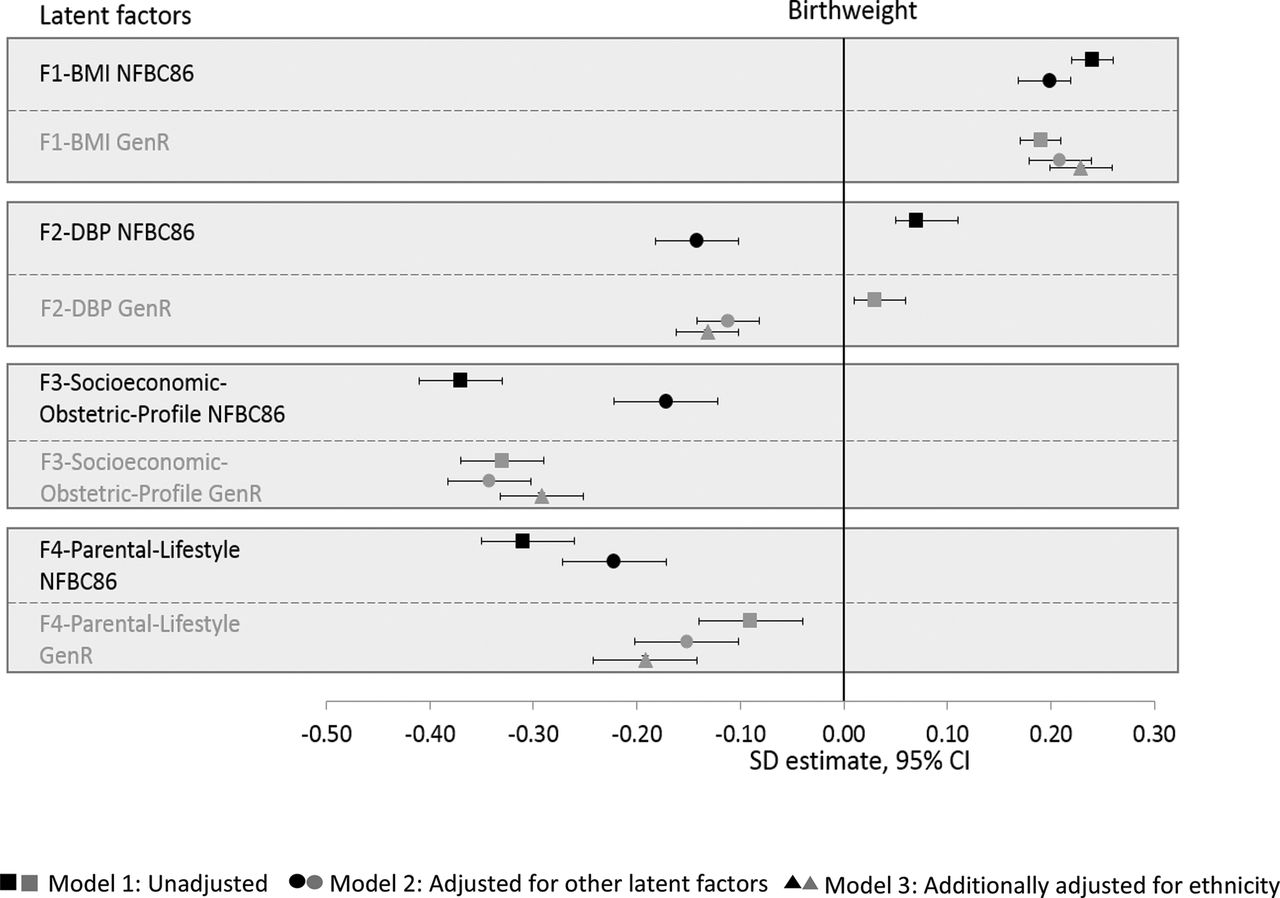
Figure 4 displays the association of each factor with birth weight, and online supplementary table S3 presents their stepwise models. Unit increase in factor score of ‘Factor1-BMI’ was associated with 0.24 (0.22, 0.26) SD and 0.19 (0.17, 0.21) SD higher birth weight in NFBC1986 and Generation R, respectively. This remained unchanged following adjustments. ‘Factor1-BMI’ showed the most robust association with birth weight and showed strong influence on the associations of other latent factors with birth weight. The association between ‘Factor2-DBP’ and birth weight reversed upon adjustment for the other latent factors and was most strongly confounded by ‘Factor1-BMI’. A unit increase in ‘Factor2-DBP’ factor score was associated with −0.14 (−0.18, −0.10) SD decrease in birth weight in NFBC1986 and −0.13 (−0.16, −0.10) SD decrease in Generation R (Model 2).

Forest plot showing association of the four latent factors with birth weight, corrected for gestational age and sex (SD estimate, 95% CI) in the NFBC1986 and the Generation R Study. NFBC1986, Northern Finland Birth Cohort 1986.
‘Factor3-Socioeconomic-Obstetric-Profile’ and ‘Factor4-Parental-Lifestyle’ showed negative associations with birth weight (figure 4 and online supplementary table S3). One unit higher ‘Factor3-Socioeconomic-Obstetric-Profile’ factor score (ie, more disadvantage) was associated with −0.37 (−0.41, −0.33) and −0.33 (−0.37, −0.29) SD lower birth weight in NFBC1986 and Generation R, respectively (Model 1) (online supplementary table S3). Although ‘Factor3-Socioeconomic-Obstetric-Profile’ had the largest effect on birth weight compared with the other latent factors in both cohorts, it was highly attenuated by the synergistic influence of ‘Factor1-BMI’ and ‘Factor4-Parental-Lifestyle’ in NFBC1986. Similarly, one unit increase in ‘Factor4-Parental-Lifestyle’ factor score was associated with −0.31 (−0.35, −0.26) and −0.09 (−0.14, −0.04) SD decrease in birth weight in NFBC1986 and Generation R (Model 1). The addition of ‘Factor3-Socioeconomic-Obstetric-Profile’ markedly attenuated the association (−0.17, 95% CI −0.22 to −0.12) in the NFCB1986, whereas the association became stronger (−0.24, 95% CI −0.29 to −0.19) in Generation R (online supplementary table S3). Similar directions of association were observed with small and large for GA between both cohorts in the sensitivity analysis (online supplementary figures S4, S5 and table S7).
Cumulative BPS score
The score was normally distributed across both cohorts. An increase in BPS score was negatively associated with birth weight and showed a graded decrease in birth weight. The association of the highest BPS risk category with birth weight was stronger in the NFBC1986 than Generation R (figure 5, online supplementary table S4).

Association between cumulative BPS score with birth weight, corrected for gestational age and sex in the NFBC1986 and the Generation R Study. BPS, biopsychosocial; NFBC1986, Northern Finland Birth Cohort 1986.
Additionally, in Generation R, proportions of smokers between European and non-European mothers (~18.5%) were comparable; however, drinking any alcohol was more prevalent among European mothers (47.9%) (online supplementary table S5). Compared with European participants, lower birth weight was observed among individuals from Cape Verdean, Surinamese and Dutch Antillean ethnicity (online supplementary table S6).
DISCUSSION
Our study focused on the interplay between a set of prenatal BPS determinants of birth weight. We identified that similar unfavourable factors tended to cluster and showed comparable influence on birth weight in two European populations, born 16–20 years apart. Noticeably, across both cohorts, biological factors had consistent associations with birth weight, while other factors showed more heterogeneous associations. Importantly, the cumulative score of BPS factors was negatively associated with birth weight, highlighting a possible snowball effect of BPS determinants.
Latent factors
We observed distinct variable patterns in the latent factors. Variables related to BMI and DBP loaded strongly into different clusters, which is expected as BMI and DBP were repeated measures at multiple time points. Although BMI and DBP clearly fall in the biological realm, BMI represents both a biological construct and a reflection on the lifestyle and social context.23 The third factor showed a mix of variables focussing on mothers prenatal profile, where lower maternal age had the strongest loading followed by ‘no house ownership’, ‘null-parity’, and ‘unmarried status’ and ‘no previous pregnancy complications’ having the weakest loading. The current labelling of this factor can raise caution to reduce misinterpretation of the underlying mechanism and the possible stigma. It may capture a population of mothers with comparable behaviour, that is, with lower age to be nulliparous, having no house ownership, being unmarried and absence of previous pregnancy complications. However, no house ownership and unmarried status also highlight financial instability and may reflect psychological stressor during pregnancy. Despite the uncertainty, it is very interesting to note how these variables load onto one factor in influencing health that replicates between cohorts. Lastly, unhealthy behaviours in both parents such as alcohol use and smoking clustered together. It is often noted that partners influence each other’s lifestyle and behaviours.24 Thus, using data-driven approach allowed us to observe structures that are unknown, without enforcing a prior categorisation. Nevertheless, modelling psychosocial factors is challenging. Martikainen et al hypothesised that individual health outcomes are conditioned and moderated by the social structures (non-psychosocial pathways) in which they exist.25 It is important to note, however, that individual’s psychological well-being partly depend on the social environment we live in.26 We observed a positive association between ‘Factor1-BMI’ and birth weight, consistent with observational studies.27 28 Tyrell et al demonstrated a positive causal genetic association between maternal BMI and birth weight.9 A recent meta-analysis has identified maternal pre-pregnancy weight in influencing child’s health (overweight/obesity throughout childhood) more than gestational weight gain during pregnancy.29
DBP emerged as a stronger predictor of birth weight than SBP in our study (online supplementary table S1). DBP is a more stable, reliable and easily measurable marker of BP, and believed to be the main contributor to the development of pre-eclampsia.30 The ‘Factor2-DBP’ showed a positive-unadjusted association with birth weight, but when adjusted for the other factors, particularly ‘Factor1-BMI’, interestingly, the association was reversed in both cohorts, and this has been noted in previous studies as well (online supplementary table S3).9 31 It is well established that maternal BMI positively associates with birth weight as well as DBP.32–34 This suggests that the attributable effects of BP on birth weight can be highly confounded by other metabolic constituents. The mechanism underlying high maternal BP and reduced fetal growth is yet unclear. It has been speculated that increased maternal DBP could possibly be a mechanism to compensate for placental dysfunction and as such might be a consequence of restricted fetal growth.35
‘Factor3-Socioeconomic-Obstetric-Profile’ and ‘Factor4-Parental-Lifestyle’ showed negative association with birth weight, but heterogeneity in the effect size was observed between the cohorts. In NFBC1986, sequential adjustment of ‘Factor1-BMI’ and ‘Factor4-Parental-Lifestyle’ considerably attenuated the associations between ‘Factor3-Socioeconomic-Obstetric-Profile’ and birth weight. ‘Factor3-Socioeconomic-Obstetric-Profile’ closely correlated with ‘Factor1-BMI’ and ‘Factor4-Parental-Lifestyle’ (figure 3), and a robust association of ‘Factor1-BMI’ with higher birth weight may explain the attenuation of this relationship. This also explains the attenuation of association between ‘Factor4-Parental-Lifestyle’ and birth weight on the addition of ‘Factor3-Socioeconomic-Obstetric-Profile’ indicating overlapping of variables suggesting social construct in both factors through similar underlying pathways.
In contrast, in Generation R, the association with birth weight increased when ‘Factor4-Parental-Lifestyle’ was adjusted for ‘Factor3-Socioeconomic-Obstetric-Profile’ and ethnicity. This maybe because these factors are negatively correlated in Generation R and it is important to acknowledge important structural differences highlighted by the correlation structure of the observed variables of these latent factors between cohorts. The largest differences were observed in the correlation of maternal alcohol use with house ownership and maternal age, which is much stronger in Generation R than NFBC1986. We also noted an association of a more suboptimal ‘Factor4-Parental-Lifestyle’ with lower birth weight among participants of European ethnicity. The frequency of alcohol use among European mothers was higher than in the overall group of non-European mothers; however, there was high heterogeneity among non-European groups,36 but the difference in smoking was minimal (online supplementary table S5). Further, non-European ethnicities, particularly Dutch Antilleans, Cape Verdeans and Surinamese, were associated with a lower birth weight compared with the Dutch group (online supplementary table S6), which may be related to social, cultural and genetic disparities.10
Cumulative BPS score
Importantly, the cumulative BPS score of all four factors demonstrated a graded decrease in birth weight with increasing score in both cohorts, thus showing the snowball effect of BPS construct. The uniformity of directions of association and distribution of scores across both cohorts highlights the validity, predictability and feasibility. This specifies the importance of environmental and societal exposures along with biological components in contributing birth weight, emphasising the BPS paradigm of birth weight that supports Engel’s proposition.12, 37 Importantly, unhealthy behaviours further influence components of metabolic health including maternal BMI and BP. These results posit that none of these determinants alone bring about health or illness, but their interaction determines the outcomes. Regarding multi-factorality, our findings share similarities with a Canadian study showing that the level of maternal perceived stress was influenced both by social support and self‐esteem. The psychosocial variables indirectly affected fetal growth mediated by behavioural and biological factors.38
We included birth weight as continuous measure. However, sensitivity analysis with small or large for GA showed similar patterns and directions of relationship in both cohorts (online supplementary figures S4, S5 and table S7). Categorising assumes constant relation between dependent and independent variables within intervals, concealing information on non-linear relations. Thus, any biological plausible change in effect within an interval will be lost.39
Strengths and limitations
The study included cohorts with rich prenatal data on mother and children. We benefitted from using factor analysis, which empirically unravels the commonalities between different BPS determinants and bases the weights of these on the strength of their empirical relation rather than the cumulative approach that applies equal weighting to all the components.40 Our model was built on the NFBC1986 data and tested for feasibility in Generation R, which is 16–20 years younger in birth chronology. This allowed us to elucidate the differences of BPS exposures on offspring health between the two populations, providing further support for addressing the environmental and societal exposures.
In terms of limitations, maternal smoking and alcohol use were self-reported, and may be under-reported due to social undesirability. Missing data are pervasive in cohort studies. However, we used MPlus, which uses all the available data to estimate the model using full information maximum likelihood to account for missing data. It is always challenging to label latent factors and we have tried to label them carefully to represent their underlying construct. We aimed to include easily available measures in our study and used factor analysis to facilitate ease of interpretation by concise representation of similar measures, but this may have led to loss of some valuable information pertaining to the individual variables. The availability of direct measures of psychological factors and stress enabling harmonisation between cohorts was limited. However, the proxy variables used in the study are well established and widely used measures in social medicine and also well interpretable among the clinicians. Paternal data were limited in our study, which would have been beneficial to highlight the coexisting pathways between maternal and paternal variables.
CONCLUSION
We have derived a composite structure between prenatal BPS factors associated with birth weight, providing clarity on a set of measures that present a cumulative risk. It is imperative to link concepts from both social and biological sciences to achieve a comprehensive overview of the possible pathways in the development of the disease. Cross cohort analysis between two ethnically different European population elucidated that psychosocial construct may vary from generation to generation in influencing health. This analysis is exploratory and opens the possibility to enumerate how BPS adversities cluster over the life course and snowball risk to offspring health. Furthermore, it broadens the scope of clinicians gaze in the selection and tailoring of prenatal interventions and preventive strategies for mothers at individual level.
What is already known on this subject
Offspring’s birth weight is determined by a mixture of prenatal factors including maternal pre-pregnancy body mass index, maternal age, birth order, genetics, along with environmental factors such as smoking, alcohol, occupation of the parents, forming a biopsychosocial construct. Despite decades of research, the interplay between these biopsychosocial factors collectively influencing birth weight still requires more attention and empirical evidence.
What this study adds
The study identifies a maternal biopsychosocial construct of birth weight and disentangles the underlying relationships. Variables related to maternal biopsychosocial health are separated into biological factors such as body mass index (Factor1-BMI) and diastolic blood pressure (Factor2-DBP) and others characterised by maternal prenatal profile (Factor3-Socioeconomic-Obstetric-Profile) and last factor pertaining to lifestyle behaviours of parents (Factor4-Parental-Lifestyle). ‘Factor1-BMI’ showed positive association, while other three factors showed consistent negative association with birth weight in two large birth cohorts (Northern Finland Birth Cohort 1986 and the Generation R Study, the Netherlands) with differing ethnic and social characteristics and a 16 years of birth time difference. Furthermore, ‘Factor1-BMI’ factor strongly confounds the association of the ‘Factor2-DBP’ during pregnancy with birth weight. Biopsychosocial adversity, when jointly evaluated, represents a cumulative risk of lower birth weight. The study highlights the role of biopsychosocial components in snowballing risk to lower birth weight, as well as heterogeneous social construct between generations.
Acknowledgments
We thank all cohort members and researchers who have participated in the study. We also acknowledge the work of the NFBC project centre. The authors gratefully acknowledge the contribution of all children and parents, general practitioners, hospitals, midwives and pharmacies involved in the Generation R Study. The Generation R Study is conducted by the Erasmus Medical Center (Rotterdam) in close collaboration with the School of Law and Faculty of Social Sciences of the Erasmus University Rotterdam; the Municipal Health Service Rotterdam area, Rotterdam; the Rotterdam Homecare Foundation, Rotterdam; and the Stichting Trombosedienst & Artsenlaboratorium Rijnmond, Rotterdam (STAR-MDC).
REFERENCES
Footnotes
Correction notice This article has been corrected since it first published online. The spelling of the author Hanan El Marroun has been corrected, and affiliation number 5 has also been added.
Contributors PP designed and conducted the study. She coordinated manuscript writing and editing and had full access to the data. EL conceptualised and designed the study’s analytical strategy and critically reviewed the manuscript. FV contributed in the acquisition of data, interpretation of results and reviewed the manuscript. HEM contributed to acquisition of data, interpretation of analytical strategy and revision of the manuscript. AL, MT, ET and JM bring expert knowledge in statistical modelling and appraised the manuscript. LA-M, K-HH, IP and NR reviewed the manuscript and approved its content. VWVJ and M-RJ contributed to interpretation of data, critically reviewed the manuscript and approved its content. JFF and SS conceptualised and designed the study, directed its implementation, including quality assurance, critically reviewed and approved the final draft of the manuscript and had full access to the data. PP and SS take full responsibility for the integrity and are guarantors of the study.
Funding This work was supported by the European Union’s Horizon 2020 research and innovation programme under grant agreement No. 633595 (DynaHEALTH), and grant agreement no. 733206 (LifeCycle) H2020–824989 EUCANCONNECT, H2020–873749 LongITools, H2020–848158 EarlyCause and the JPI HDHL, PREcisE project, ZonMw, the Netherlands no. P75416; the academy of Finland EGEA-project (285547). The Northern Finland Birth Cohort 1986 was supported by EU QLG1-CT-2000-01643 (EUROBLCS) Grant no. E51560, NorFA Grant no. 731, 20056, 30167, USA/NIHH 2000 G DF682 Grant no. 50945. The general design of the Generation R Study was made possible by financial support from the Erasmus Medical Centre, Rotterdam, the Erasmus University Rotterdam, the Netherlands Organization for Health Research and Development and the Ministry of Health, Welfare and Sport. VWVJ received agrant from the Netherlands Organization for Health Research and Development (VIDI 016.136.361) and a Consolidator Grant from the European Research Council (ERC-2014-CoG-648916). The funding bodies had no role in the design and conduct of the study; collection, management, analysis and interpretation of the data; preparation, review or approval of the manuscript; and decision to submit the manuscript for publication.
Competing interests None declared.
Patient consent for publication Not required.
Data availability statement Data are available upon reasonable request.
Provenance and peer review Not commissioned; externally peer reviewed.