Article Text

Abstract
Background We aimed to investigate the relationship between potentially modifiable risk factors in middle age and disability after 13 years using the Framingham Offspring Study (FOS). We further aimed to develop a disability risk algorithm to estimate the risk of future disability for those aged 45–65 years.
Methods FOS is a longitudinal study. We used examination 5 (1991–1995; ‘baseline’) and examination 8 (2005–2008; ‘follow-up’). We included participants aged between 45–65 years at ‘baseline’ with complete predictor and outcome measures (n=2031; mean age 53.9 years). Predictors considered were body mass index, smoking, hypertension, diabetes and dyslipidaemia. We used multinomial logistic regression to identify predictors of disability or death.We assessed external validity using Australian data.
Results By examination 8, 156 participants had disability and 198 had died. Disability was associated with smoking (OR (95% CI) 1.81 (1.18 to 2.78)); obesity (2.95 (1.83 to 4.77)); diabetes 1.96 (1.11 to 3.45) and being female (OR 1.67 (1.13 to 2.45). The model performed moderately well in predicting disability and death in an Australian population. Based on our algorithm, a 45-year-old man/woman with the combined risk factors of obesity, diabetes and smoking has similar likelihood of surviving free of disability to a 65-year-old man/woman without any of the same risk factors.
Conclusions and relevance The derived risk algorithm allows, for the first time, quantification of the substantial combined impact on future disability of key modifiable risk factors in mid-life. Here we demonstrated the combined impact of obesity, diabetes and smoking to be similar to 20 years of aging.
- Epidemiology of ageing
- AGEING
- DISABILITY
- DIABETES
- OBESITY
Statistics from Altmetric.com
Introduction
With the increased life expectancy achieved over the last century, the promotion of healthy, or successful, ageing becomes increasingly relevant. Disability is an indicator of overall health and encompasses different aspects of limitations in mobility or activities of daily living (ADL).1 ADL disability is considered the most severe form of disability and predicts dependence and admission to nursing homes.2 ,3
Previously, risk indices have been developed to estimate risk for individual chronic diseases, such as cardiovascular disease and dementia.4–7 However, little has been done regarding estimating risk for an overall health indicator, such as disability. While studies have either examined individual risk factors for disability, including smoking, physical activity, obesity and diabetes8–14 or identified risk factors for various types of disability including mobility limitations,15–17 to the best of our knowledge, only one risk score exists for estimating the risk of disability from multiple risk factors combined.18 This analysis used a cohort of elderly participants,14 with risk factors ascertained at baseline and disability measured 6 years later. Targeting modifiable risk factors at mid-life, before the onset of any disability, is an important strategy to compress morbidity and promote healthy aging.
We aimed to investigate the cumulative 13-year risk of physical disability from potentially modifiable risk factors using the Framingham Offspring Study (FOS). We further aimed to develop a risk algorithm based on the twin outcomes of disability and death to estimate the risk of developing future disability for those aged 45–65 years.
Methods
Framingham Offspring Study
The FOS is a cohort of 2426 men and 2587 women with a first examination occuring between 1971 and 1975 (mean age 36 years, range 5–70). Participants were followed up 8 years after the first examination and approximately every 4 years thereafter where an extensive medical history was obtained. Clinical examinations included measured height, weight and blood pressure measurements. Blood analyses included fasting glucose and lipids. Baseline characteristics of study participants, study design and participant consent have been previously described.19–21
Disability questionnaires were first administered from examination five between 1991 and 1995. FOS data are available through to examination 8 (2005–2008). Data from the fifth examination (1991–1995) was used as our baseline data with examination eight (2005–2008) as our follow-up. Mean follow-up time was 13 years (SD 2.1). We included those aged between 45 and 65 at examination five who also attended examination eight (n=1925) or died before examination eight (n=227). We excluded those with disability at baseline (n=75) and missing data on variables of interest (n=46). A total of 259 participants were lost to follow-up between examinations five and eight. The total study population for our analysis was 2031 (mean age 53.9 years; 48% men). The study protocol was approved by the Monash University standing committee on ethics in research involving humans (CF 11/2075–2011001130).
Measures of disability
Disability was ascertained by asking participants if a particular activity was carried out during the course of a normal day and, if so, was help needed. Responses were graded ‘0’ for ‘no help needed, independent’; ‘1’ for ‘uses device, independent’; ‘2’ for ‘human assistance needed, minimally dependent’; ‘3’ for ‘dependent’; and ‘4’ for ‘do not do during a normal day’. Activities corresponded to basic self-care ADLs: dressing, bathing, eating, transferring and toileting.3 No participant responded ‘4’ to any of the activities. We defined participants as having disability if their response was ‘1’ or above for at least one of these five activities. We excluded participants who reported any disability at examination five.
Potential baseline predictors
Demographic variables of interest were age and sex. We identified predictors of disability based on previously analysed associations in peer-reviewed literature, selecting predictors that are potentially modifiable and can be easily and reliably measured: smoking history, body mass index (BMI), hypertension, cholesterol, triglycerides and diabetes.11 ,13 ,14 ,22–24 Smoking was self-reported as yes if smoked regularly in the past year; otherwise no. BMI (kg/m2) was calculated from measured height and weight, and then categorised as underweight (BMI<18.5), normal weight (18.5≤BMI<25), overweight (25≤BMI<30) and obese (BMI≥30).25 As only 11 study participants were underweight at baseline, this category was included in regression models but associations for underweight were not reported. Hypertension status was yes if either an elevated measured blood pressure (systolic blood pressure ≥160 mm Hg or diastolic blood pressure ≥95 mm Hg) or the use of antihypertensive medication. Diabetes status was yes if either fasting blood glucose >126 mg/dL or being treated for diabetes with oral hypoglycaemics or insulin. Total cholesterol (TC), high-density lipoproteins (HDL) and triglycerides (TG) were approximately normally distributed and treated as continuous variables.
Statistical analysis
Baseline characteristics were compared across four groups—no disability at follow-up, disability at follow-up, died before follow-up and loss to follow-up not due to death. The last group was excluded from further analyses. All statistical analyses were conducted using STATA SE V.12.1 (StataCorp LP). We used multinomial logistic regression in stepped models to ascertain first significant predictors and second the magnitude of association between predictors and disability or death. We first modelled individual predictors adjusted only for age and sex. The modifiable risk factors that were significant predictors in the age-adjusted and sex-adjusted models were then included in the primary multivariable model additionally adjusted for age and sex. We tested for interactions between sex and all other predictor variables. As no interactions were evident, we did not develop sex-specific models.
Risk prediction algorithm
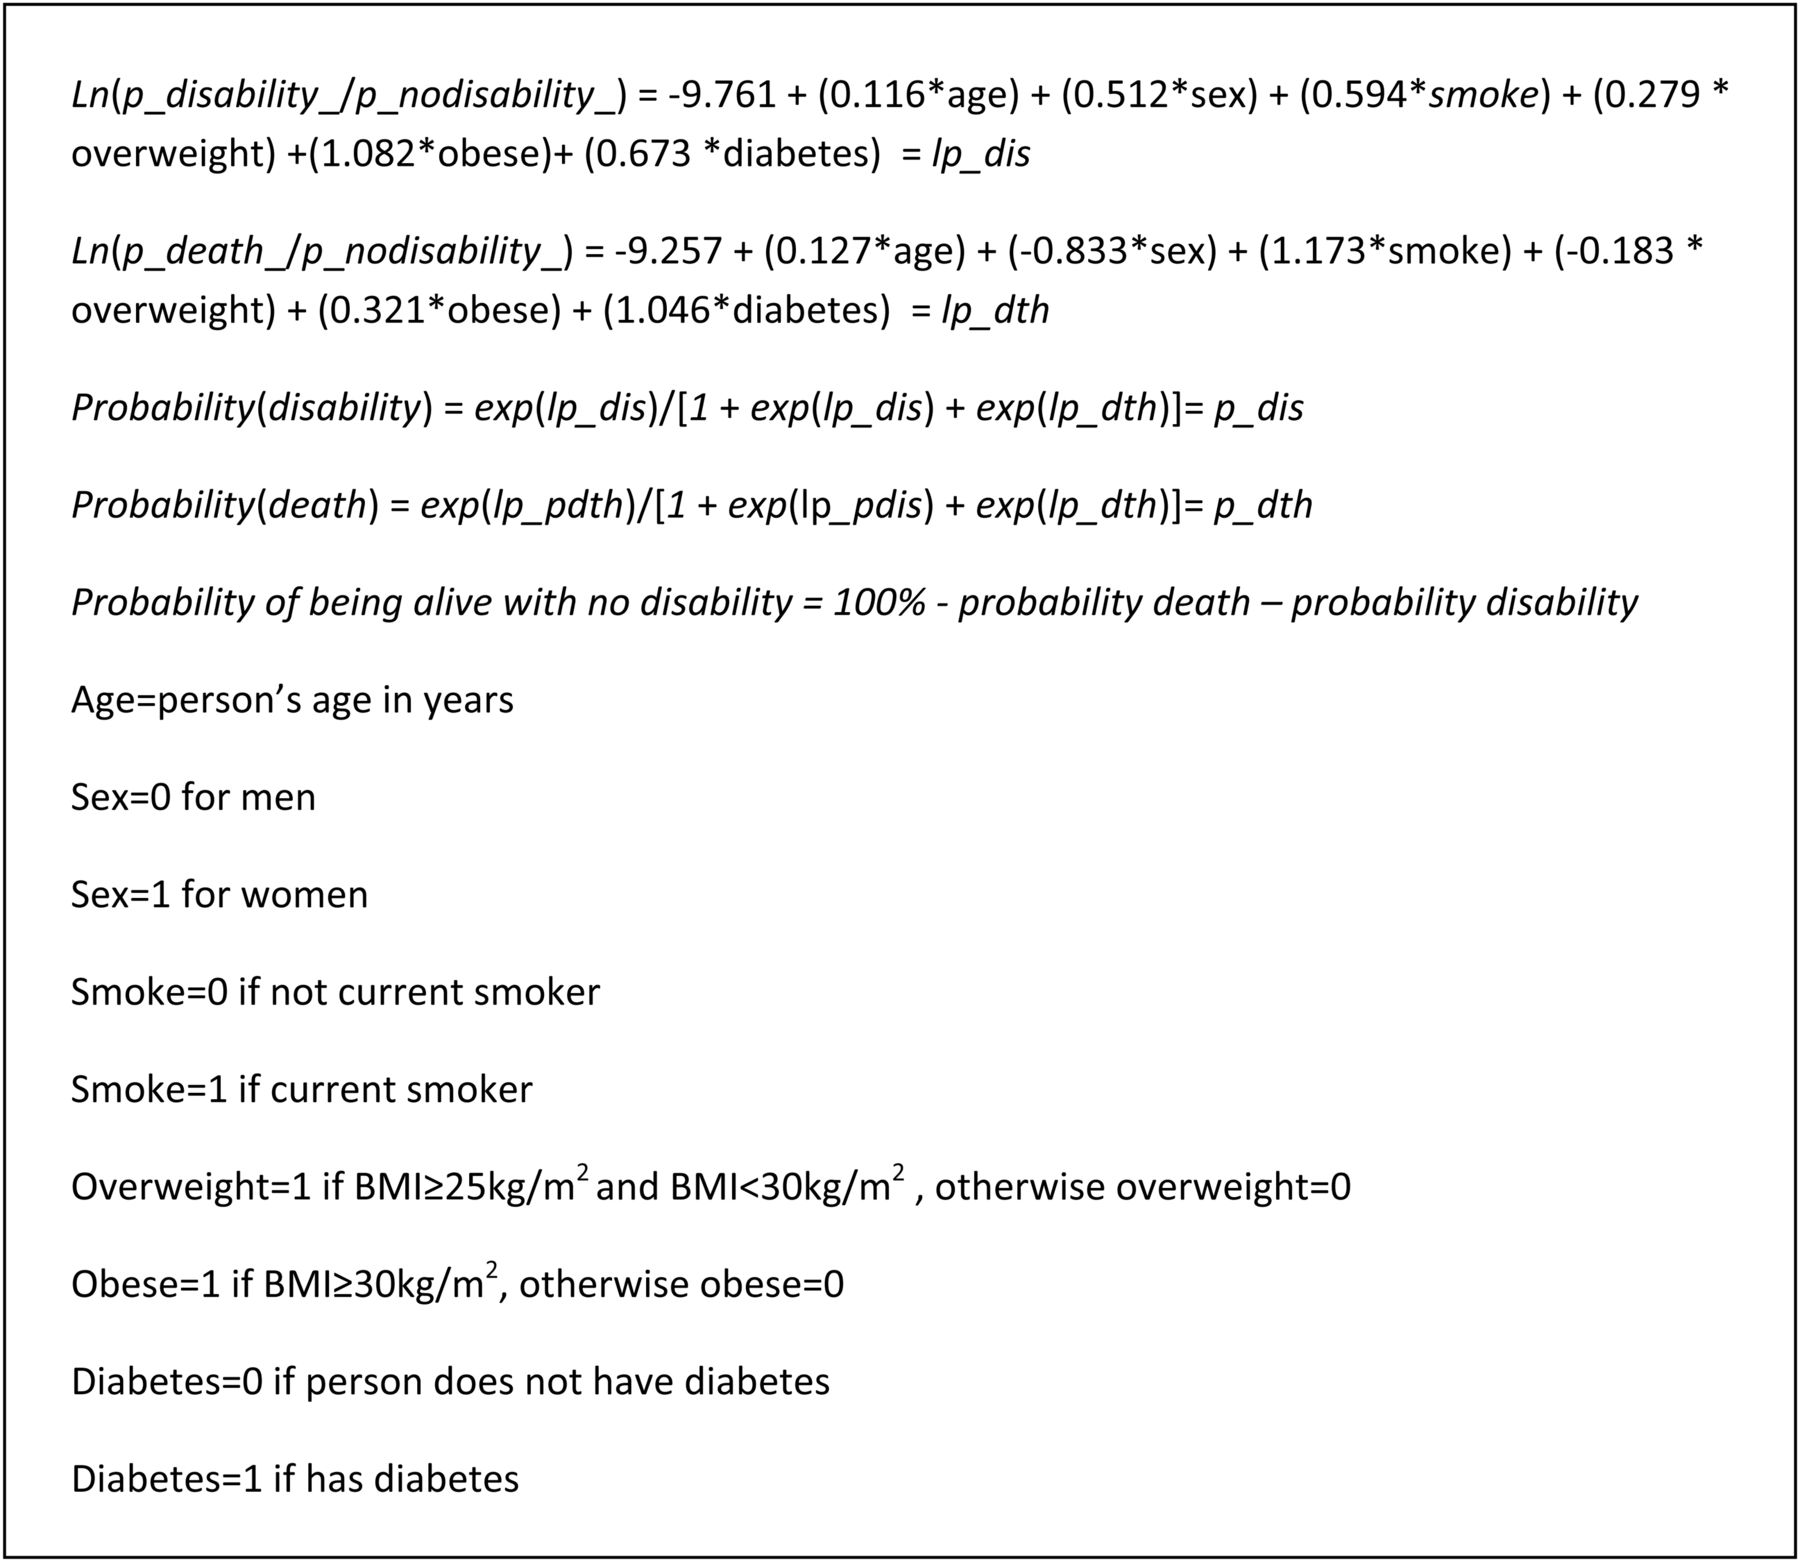
Coefficients for each predictor in the final multinomial regression model were used to calculate the 13-year risk of disability and death (figure 1). To illustrate the use of this risk prediction algorithm we generated hypothetical risk profiles for six different individuals, ranging from low to high risk of disability and mortality.

Probabilities of disability and death based on multinomial regression formulae.
Model performance and external validation
To assess model performance we tested discrimination, calibration and goodness of fit. Following our primary multinomial logistic regression analysis, we estimated the area under the receiver operating characteristic curve (AUC) to test the ability of the model to discriminate the outcomes of disability and death. We further tested AUC between the final model, a model consisting of only age and sex as predictors and models with each predictor adjusted only for age and sex. To assess calibration we used Lowess smoothing to plot predicted probabilities with observed events by equal 10ths of predicted probabilities, hence comparing the agreement between predicted and observed. Goodness of fit of the model was measured by the Brier score,which was estimated for each outcome of disability and death and summed. A Brier score of <0.25 is considered a good model fit in models for a dichotomous outcome variable.26 Hence in our multinomial regression model, comparing three outcomes, a total Brier score of <0.5 was regarded as a good model fit.
For external validation, we used data from the Australian Diabetes, Obesity and Lifestyle Study (AusDiab)27 ,28 including participants aged 45–65 at baseline (1999/2000) with available disability information at follow-up (2011/2012) or died before 30 November 2012 (n=2182; mean age 55, 47% men). Disability at follow-up was defined as having some difficulty to at least one of eating, bathing, dressing, transferring and toileting. We excluded anyone who reported limitations to bathing and dressing, the only ADL limitations that were collected, at baseline. Of the 2137 participants, 132 had disability at the 12-year follow-up and 257 died in the 12 years.
For each participant in the validation analyses, we estimated their probabilities of disability and death using the derived risk algorithm. We then evaluated the performance of the model as described above.
Sensitivity analysis—effect of adjusting for education
Information on educational attainment was not available in examination five, but available at examination two as number of years of education (which we dichotomised to ‘12 years and under’ and ‘over 12 years’). Education data were missing for 264 participants. Consequently, to maximise power of the primary analysis, these education data were used only in a sensitivity analysis to investigate the role of education as a potential confounder in the association between risk factors of interest and disability. We included education data from examination two as baseline data for our study population defined above, assuming that educational attainment did not change between examinations two and five. In the subset of our study population with available education data, we re-ran the same multinomial logistic regression, with and without adjusting for education.
Results
By examination eight, 156 participants had ADL disability and 198 had died. Of the 156 participants who reported disability, 97 reported disability to one ADL only (of which 71% were limited in bathing, 12% in transferring).Comparison of baseline characteristics across outcome groups showed higher proportions of women with disability and of men who died (table 1). Those who died or had disability were generally older at baseline than those alive and free of disability or lost to follow-up. The proportion of smokers, those with hypertension and diabetes increased from no disability to disability and death. Forty-three per cent of those with disability and 23% of those alive and free of disability at follow-up were obese at baseline.
Baseline characteristics comparing study population by outcome categories and those lost to follow-up
Multinomial logistic regression
In the age-adjusted and sex-adjusted models, the factors that were significantly associated with future disability were increased age, being female, current smoking, obesity, diabetes, higher TG and decreased HDL (table 2). Increased age, male sex, current smoking and diabetes were significantly associated with death. These were all included in the fully-adjusted model. Hypertension was not significantly associated with disability in the age and sex-adjusted model and had borderline significance with mortality (p=0.08). Given the previously demonstrated associations between hypertension and stroke mortality and the borderline significance in our age and sex-adjusted model,29 we included hypertension in our fully-adjusted model to analyse for association between hypertension and death. In this additional model, the association between hypertension and death was further attenuated and non-significant (p=0.26). Hence we did not keep hypertension in our primary fully-adjusted model.
ORs (95% CIs) for disability or death
In the fully-adjusted model, increased age, female sex, current smoking, obesity and diabetes remained significantly associated with disability (table 2). The OR (95% CI) for females was 1.67 (1.13 to 2.45); for smoking 1.81 (1.18 to 2.78); obesity 2.95 (1.83 to 4.77) and diabetes 1.96 (1.11 to 3.45). The association between HDL-cholesterol and disability as well as TG and disability were attenuated and was not significant.
Risk of ADL disability and death
We compared six hypothetical individuals according to their risk of disability and death (figure 2A and B) using the coefficients for individual risk factors derived from our fully-adjusted model. A 45-year-old man free of modifiable risk factors has risks of disability, death and surviving free of disability of 1%, 3% and 96%, respectively, while a 45-year-old man who is a current smoker with obesity and diabetes has risks of disability, death and surviving free of disability of 8%, 25% and 67%, respectively. A 45-year-old woman with none of the specified risk factors has risks of 1% of disability, 1% of death and 98% of surviving free of disability over the next 13 years. In comparison a 45-year-old woman who is a current smoker and has obesity and diabetes has risks of disability, death and surviving free of disability of 14%, 12% and 74%, respectively. Both 45-year-old man/woman with the combined risk factors has similar likelihoods of surviving free of disability to a 65-year-old man/woman without any of the same risk factors, indicating that the impact of the combined risk factors is equivalent to ageing 20 years.

Risks of disability, death, alive and free of disability in 13 years by different risk profiles. (A) men and (B) women.
Model performance and external validation
The AUC for the fully-adjusted model was 0.72 (95% CI 0.68 to 0.75) for disability and 0.76 (95% CI 0.73 to 0.79) for death (table 2). The fully-adjusted model had significantly better discrimination for disability and death than the models with age, sex and one significant predictor only; some of which in turn had better discrimination for either disability or death than a model with age and sex only (see online supplementary 1). A Lowess smoothed scatter plot of predicted risk against observed risk demonstrated good calibration of the model (see online supplementary 2). The Brier score for disability was 0.07 and for death was 0.08, giving a sum of 0.15, indicating good model fit.
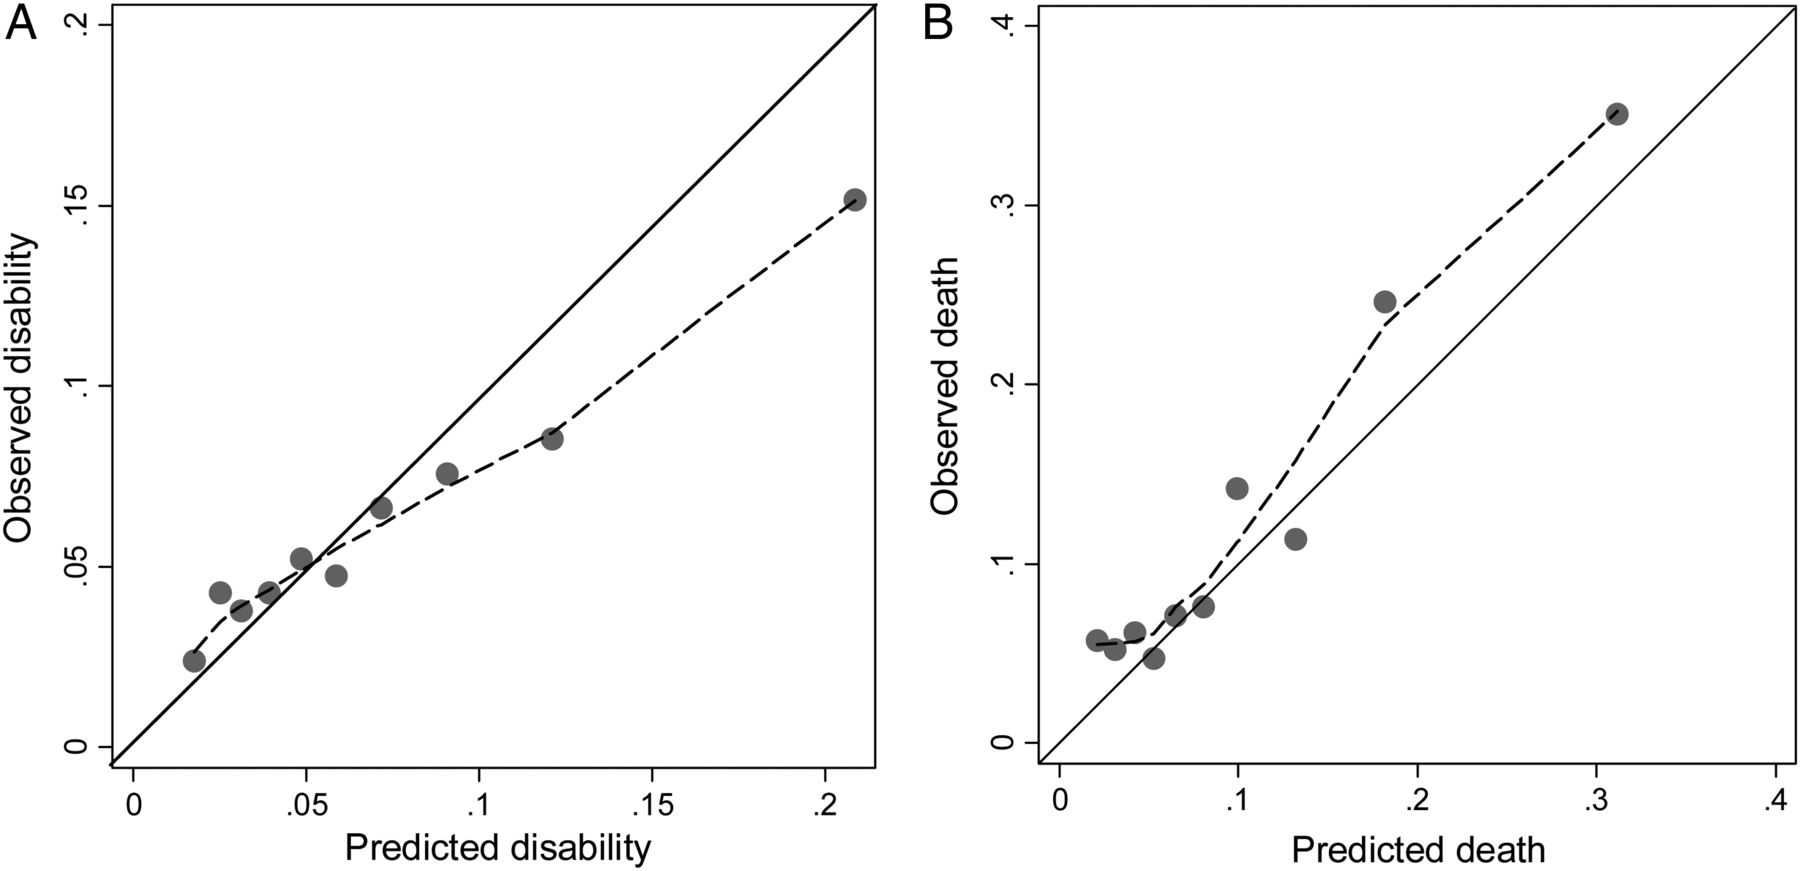
The AUCs for the model predicting disability and death in AusDiab were 0.65 (95% CI 0.60 to 0.70) and 0.72 (95% CI 0.68 to 0.75), respectively; Brier scores for disability and death were 0.06 and 0.10, respectively (table 2). The algorithm appears to overestimate the risk of disability in the highest 30% of risk groups (figure 3A) and underestimate risk of death in the highest 30% of predicted risk (figure 3B).

Light dotted line represents the smoothed association between predicted probabilities and observed frequencies with the solid line representing total agreement between the two.
Sensitivity analysis
In the analysis of the effect of education on the associations between the modifiable risk factors and disability, there were no differences in ORs, AUC or Brier score before and after adjustment for education (results not shown).
Discussion
Here we predict for the first time the combined future risk of ADL disability associated with a number of modifiable and reliably measurable mid-life risk factors.We identified obesity, diabetes and smoking as having independent, cumulative effects on future disability, mortality and consequently survival free of disability. When we looked at the combined effect of these risk factors in hypothetical individuals, those with all the risk factors had between a 25 and 60% reduction in the chance of surviving free of disability compared to someone of the same age and sex but without the risk factors, resulting in a 20-year ageing effect. The algorithm developed from FOS was externally validated in a contemporary Australian cohort and the model performed moderately well in predicting disability and death.
Prior studies analysing multiple predictors of disability which have concluded that high BMI is not a predictor of disability have involved older populations.18 ,30 There are previously identified issues with analysing health risks associated with increased BMI measured in later life. For example, a recent review and meta-analysis on the association between BMI and dementia showed a positive association between abnormal BMI and dementia when BMI was measured in mid-life, not in late-life.31 Our finding of a threefold increase in the probability of disability associated with obesity is similar to the association found by Backholer et al8 in a cohort of 6300 Australians aged under 65 at baseline and followed up over 14 years. Backholer et al reported an OR for ADL disability of 2.74 (95% CI 2.10 to 3.58) for women with class 1 obesity (BMI 30–35 kg/m2) and OR of 4.21 (95% CI 3.12 to 5.88) for women with obesity class 2 and above (BMI ≥35 kg/m2). Men with class 1 or class 2 and above obesity had an OR of 1.73 (95% CI 1.14 to 2.64) and 3.46 (95% CI 1.78 to 6.73), respectively. Backholer et al reported significant association between overweight and disability in women but not in men. We demonstrated non-significant association between overweight and disability in men and women combined. It is likely that this non-association is due to our analysis combining men and women thereby masking the effects in women, as well as insufficient power to detect a significant difference. In our model, diabetes increased the odds of disability by 96%, compared to pooled estimates from a recent meta-analysis which demonstrated a 50–80% increase in odds for disability from diabetes.24 This meta-analysis reported a paucity of studies on populations aged under 65. Our reference category for smoking included never and former smokers; the magnitude of the association would be different if we had compared current smoking to never smoking. Hence where we found an 81% increase in odds for disability associated with current smoking, Chakravarty et al30 reported a 100% increase in the risk of new moderate disability from smoking over an average of 15.6 years compared to non-smokers, in a population with a mean baseline age of 68 years. However, as our risk algorithm is a tool to encourage smokers to quit, it is more relevant for us to compare the odds of disability for a current smoker to a current non-smoker. Hypertension was not found to be significantly associated with disability or death after adjustment for the other risk factors and this may be in part due to the high proportion of those with hypertension being treated in FOS (>80%).
From a study of 10 308 civil servants in London, Britton et al32 emphasised the importance of early and mid-life social and behavioural factors in predicting successful ageing. Predictors of successful aging included mid-life socioeconomic position, non-smoking, healthy diet and exercise. Their study did not include metabolic risk factors of obesity and diabetes. One previous study analysed the correlation between multiple modifiable risk factors at middle age and long-term disability.33 The authors concluded that low modifiable health risks, an index defined by number of cigarettes, exercise habit and BMI, led to postponement of disability and compression of morbidity. In general, prior studies into multiple predictors of disability have not addressed risk factors in mid-life where the greater impact for prevention strategies can be obtained to better improve longevity without an increased cost to health expenditure.34
Strengths of the current study include the use of multinomial logistic regression to enable modelling for the two unordered outcomes of disability and death as competing risks.18 ,35 A further strength of this study was the use of data from a large, prospective cohort with objectively measured height and weight, blood pressure and blood glucose levels, decreasing the possibility of misclassification of risk factors. We analysed the risk of developing new disability in a population free of disability at baseline, thereby addressing the possibility of reverse causation. We further demonstrated that this risk algorithm performed moderately well in a contemporary Australian cohort.
Our analysis defined ADL disability as a static end point and the statistical method used precluded us from taking into account possible recovery or recurrence of disability, thereby disregarding the dynamic process of disability.36 ,37 This long follow-up period may have led to underestimation of new disability particularly in the low-risk group as this group is more likely to recover. The pattern of disability has previously been demonstrated to be more diverse in the higher risk groups37 and younger persons are more likely to develop progressive disability.36 It would be constructive for future analyses to refine this concept of a risk algorithm to model disability as a dynamic process with data permitting. We were further unable to model severity of disability as majority of participants reported limitations to one ADL only. We were further limited by the lack of ability to ascertain participants’ disability status prior to death during the 13-year follow-up and it is possible that the true disability prevalence was higher than that observed among survivors at follow-up. The similarity of the baseline characteristics of the group lost to follow with those who either developed disability or died also suggests that this was the case. Consequently, it is possible that we have slightly underestimated the associations between risk factors and disability.
The implications and use of this novel algorithm for estimating probabilities of disability, death and survival free of disability are wide ranging. Prior to this algorithm, despite the knowledge that these individual factors have associated health risks, their combined effects have been difficult to quantify. As shown in our hypothetical scenarios, a physician can now demonstrate the combined effects in terms of aging equivalance. Our findings contribute to the evidence base of the negative impact of smoking, obesity and diabetes on our ageing population, much of which will have an increasingly important role for disability rather than death as our ability to treat and manage metabolic disease continues to improve. Our findings of obesity and diabetes as strong predictors of disability and death highlight the need for stronger emphasis on preventive efforts for their precursors diet and physical activity. Management of those with high risk of disability will involve a range of clinical and behavioural interventions.38 ,39A further application of our findings is in modelling studies both for projecting disability prevalence as well as estimating the effect of interventions on reducing individual risk factors.
Conclusion
Here we demonstrated the importance of addressing modifiable mid-life risk factors to prevent ADL disability in old age, demonstrating the combined impact of obesity, diabetes and smoking to be similar to 20 years of aging. Focus on reducing these risk factors in our middle age population could lead to substantial increases in the period that our older population will live in a healthy and independent state.
What is already known on this subject
-
We know that the risk factors for disability include obesity, diabetes and smoking. The magnitude of association for each of these risk factors have previously been demonstrated. However, the cumulative effects of the combination of risk factors on development of disability have been difficult to quantify.
What this study adds
-
This is the first risk prediction algorithm to estimate the probability of surviving free of disability over time from multiple modifiable mid-life risk factors. We illustrate the use of this algorithm with hypothetical individuals with differing risk profiles, demonstrating that the cumulative effect of smoking, obesity and diabetes in midlife on surviving free of disability to self-care activities of daily living is equivalent to 20 years of ageing.
Acknowledgments
The authors would like to acknowledge the Framingham Heart Study (FHS) for access to the Offspring Datasets. The FHS is conducted and supported by the National Heart, Lung and Blood Institute (NHLBI) in collaboration with the FHS Investigators. The authors wish to thank the AusDiab Steering Committee for providing data from the AusDiab study.
References
Supplementary materials
Supplementary Data
This web only file has been produced by the BMJ Publishing Group from an electronic file supplied by the author(s) and has not been edited for content.
Files in this Data Supplement:
- Data supplement 1 - Online supplement
Footnotes
-
Contributors EW was involved in formulation of research question, design of protocol, data analysis, drafted manuscript, responsible for manuscript submission and responding to reviewer comments. AP and CS formulation of research question, design of protocol, interpretation and commented on manuscript drafts. KB and MW were involved in design of protocol, interpretation and commented on manuscript drafts. JES reviewed the final manuscript. EW and AP had full access to all of the data in the study and takes responsibility for the integrity of the data and the accuracy of the data analysis.
-
Funding This work is also supported by funding from the Australian Research Council (Linkage Project Grant 12010041 & Discovery Grant 120103277), NHMRC Project Grant 1027215 and, in part, by the Victorian Government's Operational Infrastructure Support (OIS) Program.
-
Competing interests EW is supported by Monash University Australian Postgraduate Award and Baker IDI Bright Sparks Foundation Top-up Award, AP is supported by a VicHealth and National Health and Medical Research Council (NHMRC) Fellowship. KB is supported by a National Heart Foundation fellowship. MW is supported by a NHMRC fellowship. JES is supported by an NHMRC Senior Research Fellowship (540103).
-
Ethics approval Monash University standing committee on ethics in research involving humans.
-
Provenance and peer review Not commissioned; externally peer reviewed.