Article Text

Abstract
Background Despite the well-established link between body mass index (BMI) and diabetes mellitus (DM), it remains unclear whether this association is more pronounced at certain levels of education. This study assessed the modifying effect of educational attainment on the associations between BMI and DM—as well as the joint associations of BMI and education with DM—in low-income countries (LICs) and middle-income countries (MICs).
Methods The authors used cross-sectional data from 160 381 participants among 49 LICs and MICs in the World Health Survey. Overweight and obesity levels were defined using WHO's classification. Educational attainment was classified in four categories: ‘no formal education’, ‘some/completed primary school’, ‘secondary/high school completed’ and ‘college and beyond’. We used random-intercept multilevel logistic regressions to investigate the modifying influence of educational attainment on the associations of different BMI levels—as well as their joint associations—with DM.
Results We found positive associations between excessive BMI and DM at each education level in both LICs and MICs. We found that the joint associations of BMI and education with DM were larger than the product of their separate single associations among females in LICs. With joint increases in BMI and education, males and females in LICs had similar increased odds of DM, but males had higher such odds than females in MICs.
Conclusions BMI and education are associated with the DM, but the associations seem to differ in complex ways between LICs and MICs and by gender.
Statistics from Altmetric.com
Introduction
Diabetes is a global burden that is projected to affect a total of 366 million people by 2030.1 Currently, 70% of people with diabetes live in low-income countries (LICs) and middle-income countries (MICs), and the number of people with diabetes will more than double in these countries over the next 20 years.2 It is widely acknowledged and documented that being overweight or obese is associated with an increased risk of diabetes mellitus (DM).3 According to the International Obesity Task Force (IOTF) and the WHO World Health Report in 2002, about 58% of diabetes globally can be attributed to body mass index (BMI) above 21 kg/m2.4
Higher levels of education promote the adoption of health behaviours5 and healthcare use to maintain good health.6 Because of the consistently observed relationship between education and health behaviours, lower level of education has been treated as either a risk factor for diabetes on its own7 or as a confounder for the BMI–DM relationship.8 Yet, these two approaches may not fully capture the complexity of the interrelationship between education, BMI and DM. In particular, it is still unclear whether the effect of BMI on DM is more pronounced at certain levels of education. As LICs and MICs undergo societal developments, related rapid changes in lifestyle such as dietary and physical activity patterns are boosting the epidemic of obesity, thus increasing the burden from nutrition-related non-communicable diseases (NCDs).9 Moreover, the burden of obesity is shifting from the affluent towards the poor in these countries.10 Given that obesity is strongly predictive of diabetes, a key issue is determining whether excess body weight disproportionately affects diabetes at certain levels of socioeconomic status (SES). If, for example, the effect is stronger in lower socioeconomic strata, that might further increase the predicted diabetes epidemic in LICs and MICs.
This paper focuses on educational disparities in the associations between BMI and DM. More concretely, we used educational attainment as an indicator of the subject's socioeconomic position and (1) examined the association of BMI and DM in study participants from 49 LICs and MICs, and (2) assessed whether educational attainment modified the association between BMI and DM.
Methods
Study setting and data
We used data from the cross-sectional World Health Survey (WHS) conducted by the WHO in 70 countries from 2002 to 2003. The study design and methods of the WHS have been described in detail elsewhere.11 Briefly, countries from the WHS were selected to represent six WHO regions, including high-income countries, MICs and LICs. Within each country, samples were probabilistically selected with every individual being assigned to a known non-zero selection probability. The samples were nationally representative except in China, Comoros, Congo, Côte d'Ivoire, India and the Russian Federation, where the survey was carried out in geographically limited regions. Participants were interviewed face to face using structured questionnaires in a majority of participating locations. The standardised WHS questionnaire included questions regarding demographic and socioeconomic factors. The unified methodology provided a basis for examining individual health measures across countries.11 This study included data from 22 LICs and 27 MICs based on World Bank income group classification in 2003.12
Outcome
The primary outcome of interest was the diagnosis of DM based on participants’ self-reported medical history. Participants were asked four questions about their DM status: (1) ‘have you ever been diagnosed with diabetes (high blood sugar)?’; (2) ‘have you ever been treated for diabetes?’; (3) ‘have you been taking insulin or other blood sugar-lowering medications in the last 2 weeks?’; and (4) ‘are you following specific diet, exercise regime or weight control programme for control of diabetes?’.11 We assigned the participants’ outcome as having DM if they answered ‘yes’ to question (1), or if they answered ‘don't know’ or had a missing value for question (1) but answered ‘yes’ to either one of the other three questions. The use of symptoms questions for diagnosing chronic diseases was previously validated in a diagnostic item probability study implemented in 2003 by the WHO in seven countries.13 We could not distinguish between type I, type II or gestational diabetes in our analyses.
Exposure
The exposure of interest was BMI, defined as an individual's self-reported weight (kg) divided by self-reported height squared (m2). We classified BMI into five categories using the WHO's BMI classification14: underweight (BMI<18.5 kg/m2), normal weight (BMI 18.5–24.9 kg/m2), overweight (BMI 25.0–29.9 kg/m2), obese class I (BMI 30.0–34.9 kg/m2) and obese class II and III (BMI≥35 kg/m2).
Modifier
We considered educational attainment as a modifier of the association between BMI and diabetes. Educational attainment was classified into four categories: ‘no formal education’, ‘some/completed primary school’, ‘secondary/high school completed’, and ‘college and beyond’.
Confounding variables
Demographic characteristics included age, gender, marital status (currently married or not) and urbanicity (living in urban or semiurban vs rural areas). Other covariates included smoking status (current smoker or not), alcohol drinking (ever use of alcohol or not) and four chronic conditions: angina, asthma, arthritis and depression. These four chronic conditions were considered as confounders because the presence of other chronic conditions may alter behaviour and thus BMI. At the same time, those who have these conditions may be more likely to develop diabetes and be diagnosed as such. These four conditions were defined based on participants’ self-reported medical history. Participants were also considered to have these chronic conditions if they did not know their disease status or had a missing value for each of these conditions but indicated that they had received or were currently receiving treatment for these conditions. Gross domestic product per capita, in current US$, for each country in 2003 were obtained from the UN database and was used as measure of country-level wealth.15
Analytical strategies
Statistical analyses proceeded in several stages. First, we used appropriate descriptive statistics to summarise the characteristics of the participants by their DM status within LICs and MICs. Second, we modelled DM on BMI only, educational attainment only and both using multilevel logistic regression with random intercept for country to account for clustering within country,16 adjusting for the abovementioned confounding variables. Third, we added BMI by educational attainment product terms to assess modification of the relationship between BMI and DM by education on the multiplicative scale. Finally, we further stratified our models by gender17 in addition to the stratification by World Bank income group. We estimated the ORs and the corresponding 95% CIs for the BMI–DM association at each education level, where normal weight was the reference category at each education level. We also estimated the joint association of BMI and educational attainment on diabetes using people with normal weight and no formal education as the general reference category. We adjusted for the same set of covariates across all models. All analyses were performed using SAS V.9.3 (SAS Institute Inc., Cary, North Carolina, USA).
Sensitivity analysis
To check the robustness of our results, we performed several sensitivity analyses: (1) excluding individuals with height less than 122 cm (n=3519) or greater than 211 cm (n=36), and individuals with weight that was 3 SDs above (n=1028) or 1.5 SDs below (n=4657) the crude sample mean of 62.9 kg; (2) re-analysing the data without adjustment for smoking, alcohol use, and the four chronic conditions as these factors may be conceptualised as either confounders or mediators of the BMI-DM relationship; and (3) conducting subgroup analyses by subsetting our sample into participants from the South-East Asia Region (SEAR) and Western Pacific Region (WPR) combined, and participants from other WHO regions. We also presented the same set of sensitivity analyses using six-level educational attainment variable (considering some primary school, primary school completed, secondary school completed and high school completed as separate categories) instead of the four-level categorisation used in the main analyses.
Results
Study participants
Among 238 372 eligible respondents who were age 18 years or older, 160 381 (67.3%) of them had complete data on all variables and were included in the analyses. Country-specific sample size and characteristics are presented in the web appendices (table A1). Characteristics of the excluded participants are presented in the web appendices (table A2). BMI has the most missing values. Excluded participants were less educated and less likely to live in urban area. The distributions of other covariates among excluded participants were similar to that among the participants included in the main analyses.
Table 1 shows participant characteristics by DM status. In LICs, larger proportions of participants were married, lived in urban areas, had completed secondary school or beyond, had excess BMI and other comorbidities when comparing participants with DM to those without. In MICs, participants with DM were older and more likely to have excess BMI, and had much higher prevalence of other comorbidities compared with those without DM. However, smaller proportion of DM participants were current smokers, or had completed secondary school or beyond relative to non-DM participants.
Characteristics of 160 381 participants from 49 low-income and middle-income countries by diabetes mellitus status in World Health Survey 2002–2003 data
Associations of BMI and of educational attainment with DM
BMI and educational attainment were separate predictors of DM status (table 2). In LICs, we observed increasing BMI–DM association except for the extreme BMI category in model 3. With or without holding BMI level constant, a positive gradient of educational attainment was observed (models 2 and 3). In MICs, an increasing BMI–DM association was also observed in model 3, but a slightly negative education–DM gradient was seen in model 2. After holding BMI level constant, we observed slightly positive to null education–DM association in model 3.
ORs (95% CIs) obtained from multivariable adjusted multilevel models* regressing diabetes mellitus on BMI and education but without BMI by educational attainment product terms: World Health Survey 2002–2003
Modification of BMI–DM associations by educational attainment
Table 3 depicts the association between BMI and DM across different levels of education. There was a positive BMI–DM relationship within each education level except for the extreme obese–DM association among people who completed college and beyond in LICs. When comparing the BMI–DM associations across levels of education, we observed a slightly increasing trend of the obese I–DM association but a slightly decreasing trend of the overweight–DM association as education level increases in LICs. Yet, no clear pattern of how BMI–DM relationship changed across education levels was observed in MICs.
ORs (95% CIs) obtained from multivariable adjusted multilevel models* regressing diabetes mellitus on BMI by educational attainment: World Health Survey 2002–2003
Figure 1 depicts the ORs and corresponding 95% CIs for the joint associations of BMI and educational attainment with DM (estimates are available in the web appendices table A3). Using individuals with normal weight and no formal education as the general reference group, we observed an increasing pattern in the odds of DM as BMI and education level increased among participants in LICs and MICs.
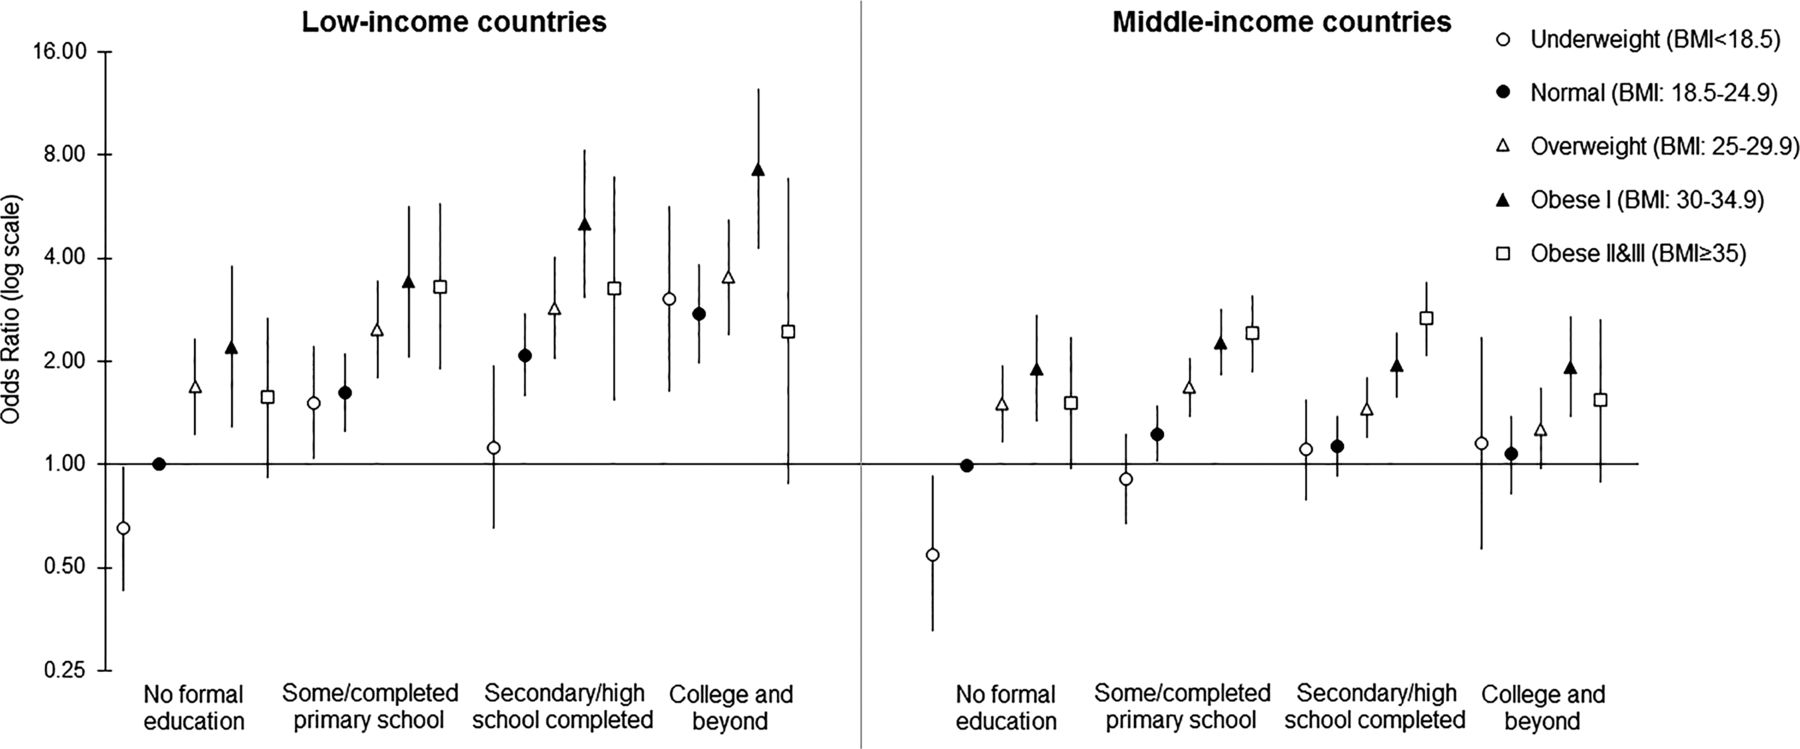
Joint associations of abnormal body mass index (BMI) and educational attainment with diabetes mellitus in 22 low-income countries and 27 middle-income countries, obtained from the multilevel regression analysis of the World Health Survey 2002–2003 data (N=160 381). Symbols represent the point estimates (ORs) while vertical bars around the symbols are the corresponding 95% CIs. Universal reference group: normal weight individuals with no formal education.
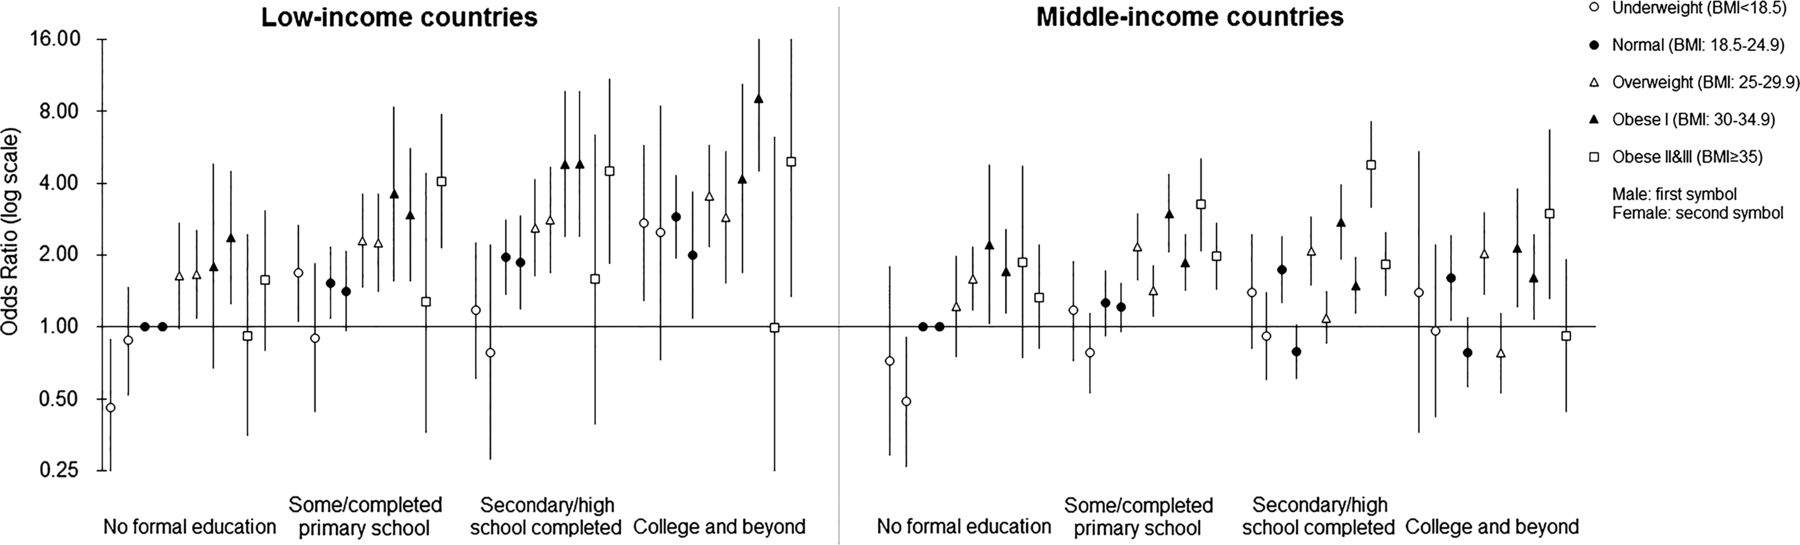
When we further stratified by gender (figure 2), we also found increased odds of DM as both BMI and education level increased. In general, the magnitude of the odds of DM was slightly higher in LICs than in MICs. Among people with same education level in LICs, the BMI–DM associations were similar among males and females except for the extreme BMI category. Among females in these countries, the odds of DM associated with co-occurrence of excessive BMI and higher education level were slightly over and above the odds associated with the two exposures individually. However, among people with same education level in MICs, males had stronger BMI–DM associations than females, with the largest discrepancy seen among people completed secondary or high school.

Gender-specific joint associations of abnormal body mass index (BMI) and educational attainment with diabetes mellitus in 22 low-income countries and 27 middle-income countries, obtained from the multilevel regression analysis of the World Health Survey 2002–2003 data (N=160 381). Symbols represent the point estimates (ORs) while vertical bars around the symbols are the corresponding 95% CIs. Universal reference group among males or females: normal weight individuals with no formal education.
Results from sensitivity analysis
Sensitivity analyses revealed similar patterns as that in figure 1 after excluding observations with extreme values on height or weight, or without adjusting for smoking, alcohol use and four chronic conditions (web appendices table A4.1 and A4.2, respectively). Subgroup analyses among participants from SEAR and WPR showed a similar pattern of association estimates as that in LICs in figure 1. Repeated sensitivity analyses using six-level educational attainment (web appendices tables A5 and A6.1–A6.3) revealed similar patterns as the analyses using four-level educational attainment.
Discussion
Analyses of this large, multicountry sample showed that the BMI–DM association was weakly positively modified by educational attainment on the multiplicative scale among female in LICs, but such modification is unclear in MICs. In the gender-specific joint association models, males and females in LICs had similar increased odds of DM as both BMI and education level increased. Yet in MICs, the odds of DM were higher among males than among females when BMI and education level were the same.
Low SES has been linked to disease risk factors such as smoking,18 lower consumption in fruit and vegetables,19 and physical inactivity.20 Nevertheless, evidence is scant on how SES modifies the risk of getting the disease when those risk factors are present. We found weak education-related heterogeneity in the BMI–DM association among females in LICs. This heterogeneity was not seen among males possibly due to the unstable estimates of the extreme BMI category. Education reflects material and intellectual resources of individuals and their families, and affects the receptiveness to and use of health information and access to health services.21 People who have better access to care may be more likely to be diagnosed with DM when they are overweight or obese. It is also possible that educational attainment is a proxy for factors that interact with BMI to cause or complicate DM. An example could be work stress, as demonstrated in the Whitehall II Study.22
No clear pattern of modification by education was seen in MICs as the BMI-adjusted education–DM association was less prominent, if at all present, in these countries compared with that in LICs. When we quantified the joint associations of both BMI and educational attainment with the odds of DM, we found that the strength of the associations was stronger in LICs than in MICs. This difference seemed attributable to the different BMI-adjusted education–DM associations found in LICs versus MICs as well. Different from LICs, higher education level has been associated with decreased odds of DM among Mauritian Indians23 and people in Lithuania.24 Even accounting for BMI, such negative education–DM association was found in studies done in Brazil25 and China.26 LICs and MICs are undergoing rapid transition of dietary patterns and physical activity levels,27 and the burden of obesity shifts towards the poor as these countries go through rapid social and economic development.10 Accordingly, some experts have hypothesised that the burden for these nutrition-related NCDs will eventually shift towards lower SES groups within these countries,28 ,29 based on the close relationship between obesity and DM and the negative SES–DM association consistently found in high-income countries.30 Our study offered a snapshot of the ahead mentioned shifts occurring in these countries.
In gender-specific joint association models, we found that with joint increases in BMI and education, males and females in LICs had similar increased odds of DM but males had higher such odds than females in MICs. Such a difference was largely due to the null or weakly negative BMI-adjusted education–DM association among females compared with the weakly positive BMI-adjusted education–DM association among males in these countries. The observed education–DM associations by gender and country income level are in agreement with another study examining the education-related relative inequality in NCD prevalence using the WHS data.17 Previous studies done in Germany31 and across Europe32 found a negative SES–DM association, and such association was stronger in women than men. However, the mechanism of such gender differences remains unclear.7 ,31 Few studies33 have examined the gender differences in the SES–DM associations in LICs and MICs, and such differences need to be further explored in these countries.
Previous studies have suggested that compared with other parts of the world, the increase in type 2 diabetes in Asia occurs in people with much lower BMI.34 Lower thresholds for defining abdominal obesity for Asians have also been proposed by the WHO.35 Asian country subgroup analyses revealed results consistent with those of the LICs since the majority came from LICs.
This study has a number of strengths, including the use of standardised global health data involving many different countries and continents. This allowed us to conduct a novel global comparative analysis of associations of BMI and educational attainment with DM in both LICs and MICs. We were able to adjust for both contextual and compositional confounding factors. Furthermore, we tested the robustness of our results through various sensitivity analyses.
There are methodological limitations to the presented study. The cross-sectional nature of the data limits our ability to draw causal inferences here. There is potential misclassification of DM using self-reported diabetes status and the potential under-diagnosis of DM among individuals with lower SES17 due to a lack of access to healthcare. Not being able to exclude pregnant women and therefore gestational DM may also contribute to the potential bias due to misclassification. Nevertheless, the self-report of physician-diagnosed chronic conditions using standardised questionnaires with algorithms has been used successfully in published studies8 ,17 ,36 and has shown to provide valid estimates of diabetes prevalence.37 Misclassification of BMI using self-reported height and weight is also possible; however, sensitivity analyses showed that our results are robust against extreme values for height and weight. Although the diagnosis of diabetes may itself lead to weight loss, this is likely to result in only a moderate bias towards the null since current BMI correlates closely with previous BMI.
This study offers a new perspective on the important co-dependence of DM on both BMI and education. In our study population, DM was positively associated with excess BMI in both LICs and MICs. The education–DM gradient was positive in LICs with or without accounting for the possible mediation by BMI. The slightly negative education–DM gradient seen in MICs became weakly positive to null after accounting for BMI. The co-dependence of DM on both BMI and education seems to differ in complex ways between LICs and MICs and by gender. Future studies are needed to follow-up on our findings to examine whether such heterogeneity exists using more recent data in these countries and to explore gender difference and the difference between LICs and MICs in the co-dependence of DM on both BMI and education. Future research could also investigate the role of contextual risk modifiers of the education, BMI and DM interrelationships, especially given the importance of NCDs for individual and population health, particularly in LICs and MICs.38 ,39
What is already known on this subject
-
Overweight and obesity have been linked with increased risk of diabetes in both low-income countries (LICs) and middle-income countries (MICs).
-
Increased education is negatively associated with diabetes in some LICs and MICs and is often considered as a confounder of the body mass index (BMI)–diabetes relationship.
-
Little is known about whether the effect of BMI on diabetes is more prominent at certain levels of education.
What this study adds
-
We observed a positive relationship between excess BMI and diabetes mellitus (DM) within each education level in both LICs and MICs.
-
The joint associations of BMI and educational attainment with DM were higher than their combined separate associations on the multiplicative scale among females in the LICs but not in the MICs.
-
The joint associations of BMI and educational attainment with DM were similar among males and females in LICs but were higher among males than females in MICs.
Acknowledgments
The authors would like to thank Dr Caroline A Thompson and Maral DerSarkissian for their helpful comments and edits.
References
Supplementary materials
Supplementary Data
This web only file has been produced by the BMJ Publishing Group from an electronic file supplied by the author(s) and has not been edited for content.
Files in this Data Supplement:
- Data supplement 1 - Online supplement
Footnotes
-
Contributors AW participated in study conception, design, analysis and interpretation of results and drafting of the article. KS assisted with interpretation of results and made critical revisions to the paper for important intellectual content. OAA supervised the study and participated in study conception, design and interpretation of results, and made critical revisions to the paper for important intellectual content. All the authors approved the final version for submission.
-
Funding This work was supported by a Veni career grant (# 916.96.059) awarded to OAA by the Netherlands Organization for Scientific Research (NWO).
-
Competing interests OAA was supported by Veni career grant # 916.96.059 from the Netherlands Organization for Scientific Research (NWO). AW was supported by an International Doctoral Fellowship from the American Association of University Women (AAUW), a doctoral scholarship from the Chinese Scholarship Council (CSC), and a scholarship from the Chinese-American Engineers and Scientists Association of Southern California (CESASC).
-
Provenance and peer review Not commissioned; externally peer reviewed.