Article Text

Abstract
Background Accumulating evidence suggests that television (TV) viewing is associated with cardio-metabolic risk, but little is known about how this relationship unfolds over the life course. This study employs a life course epidemiological framework by examining the potential cumulative effect of frequent TV viewing during adolescence and young adulthood on the prevalence of metabolic syndrome in mid-adulthood; and whether TV viewing during adolescence constitutes a sensitive period for the development of the metabolic syndrome in mid-adulthood.
Methods We used data from the Northern Swedish Cohort, a nationally representative cohort comprising 855 participants (80% of the baseline sample). Data were collected during 1981–2008 and analysed in 2013. Logistic regression was applied to examine the associations between TV viewing at ages 16, 21 and 30 years, and the metabolic syndrome at age 43 years.
Results Cumulative frequent TV viewing was associated with subsequent prevalence of the metabolic syndrome after adjustment for potential confounders (p for trend=0.026). Watching ‘several shows a day’ compared with ‘one show/week’ or less at age 16 years was associated with the metabolic syndrome at age 43 years after adjustment for later exposure (TV viewing at ages 21 and 30 years) and potential confounders (OR 1.86, 95% CI 1.06 to 3.27).
Conclusions The number of life periods of frequent TV viewing during adolescence and early adulthood influenced cardio-metabolic risk in mid-adulthood in a dose-dependent manner, corresponding to a cumulative risk life course model. Additionally, TV viewing in adolescence may constitute a sensitive period for the metabolic syndrome in mid-adulthood.
- Physical Activity
- Life course epidemiology
- Lifecourse / Childhood Circumstances
Statistics from Altmetric.com
Introduction
Sedentary behaviours have been defined as ‘any waking behaviour characterised by an energy expenditure ≤1.5 METs (metabolic equivalents) while in a sitting or reclining posture’.1–2 This is distinct from being ‘inactive’ (ie, not meeting the guidelines for moderate-intensity to vigorous-intensity physical activity). An increasing body of evidence shows that sedentary behaviours, independent of physical activity levels, are associated with health consequences and risk of premature mortality in adults.3 There is also accumulating evidence suggesting that sedentary behaviour, using television (TV) viewing as a proxy, is associated with unfavourable body composition and decreased fitness in school-aged children and youth.4 However, the relationship of TV viewing during adolescence and young adulthood with cardio-metabolic risk later in mid-adulthood is still unclear.
Life course epidemiology examines the long-term effects on later health or disease risk of physical or social exposures during gestation, childhood, adolescence, young adulthood and later adult life.5 Two common concepts in life course epidemiology are accumulation of risk and sensitive period. Kuh et al5 describe accumulation of risk as the increase in disease risk as life course exposures gradually accumulate, irrespective of timing of exposure. Conversely, a sensitive period can be described as a life course period when an exposure has a stronger effect on development and subsequent disease risk than it would at other times, or during which exposures result in long-term health effects independently of later exposures.6
We have shown previously that self-reported TV viewing at age 16 years predicts the risk of metabolic syndrome at age 43 years, independent of adolescent and adult physical activity.7 However, it is not clear how TV viewing in adolescence and adulthood contribute to later cardio-metabolic risk. In the current report, we aimed to extend our previous findings by investigating the impact of TV viewing over the life course on the prevalence of metabolic syndrome in mid-adulthood. More specifically, we examined the potential accumulative effect of frequent TV viewing for up to three life periods (at ages 16, 21 and 30 years), and whether TV viewing during adolescence constitutes a sensitive period for the development of the metabolic syndrome in mid-adulthood (age 43 years).
Methods
Participants
The Northern Swedish Cohort is a 27-year prospective cohort study that has been previously described.8 The sample (n=1083) consists of all students from the municipality of Luleå who completed the 9th grade (age 16 years) of Swedish compulsory school in 1981. Follow-up data collections were conducted in 1983 (age 18 years), 1986 (age 21 years), 1995 (age 30 years) and 2008 (age 43 years). The current study is based on data collections at ages 16, 21, 30 and 43 years. At age 43 years, 94% of the baseline sample (n=1010) who were still alive were active in the cohort. Participants were excluded if they had missing data on the metabolic syndrome (n=107 or 10.6%), or TV viewing at ages 16, 21 or 30 years data collections (n=48 or 4.8%). Consequently, the analyses were conducted in 446 men and 409 women; 80% of the baseline sample and 85% of those participating at the 2008 data collection. Ethical approval was granted by the Regional Ethical Review Board in Umeå, Sweden.
Procedures
Participants completed comprehensive self-administered questionnaires at baseline and follow-ups.8 Weight and height at age 16 years were measured by school nurses as a part of a compulsory school health examination. At age 30 years, information on weight and height was self-reported. At age 43 years, the participants took part in a comprehensive health examination performed by trained medical personnel.9 This included measurement of: waist circumference; blood pressure according to the WHO MONICA manual10; and venous blood sampling after an overnight fast. Blood samples were analysed for high-density lipoprotein (HDL) cholesterol, triglycerides and glucose. Coefficient of variance at high/low concentration was 1.7/1.5% for triglycerides, 2.8/2.8% for HDL-C, and 1.5/1.2% for glucose.
Measures
The metabolic syndrome
Presence of metabolic syndrome at age 43 years was defined according to the International Diabetes Federation guidelines11: central obesity (waist circumference ≥80 cm for women and ≥94 cm for men) and two or more of the following criteria: (A) triglycerides ≥1.7 mmol/L, or specific treatment for that lipid abnormality; (B) HDL-C <1.29 mmol/L for women/ <1.03 mmol/L for men, or specific treatment for that lipid abnormality; (C) systolic blood pressure ≥130 mm Hg, diastolic blood pressure ≥85 mm Hg or treatment of hypertension and (D) fasting glucose ≥5.6 mmol/L or diagnosed type 2 diabetes.
TV viewing
TV viewing at ages 16 and 21 years was assessed using the question, ‘How often do you watch television?’ with five response options: (1) several shows a day, (2) one show per day, (3) one show every other day, (4) one show per week and (5) less than one show per week. Because of the low number in several categories we merged category 2 (one show per day) with category 3 (one show every other day), and category 4 (one show per week) with category 5 (less than one show per week) (see online supplementary figure S1). At age 30 years, the question on TV viewing was altered to reflect time spent watching TV (‘How much time do you spend, in general, watching TV/video?’) per week in eight categories from 0 h to >35 h/week. In conformity with earlier assessments, several categories were collapsed to create three categories: (1) <4 h/week, (2) 4–7 h/week, (3) >7 h/week. Cumulative frequent TV viewing was operationalised as the number of life periods in the category with most frequent TV viewing. TV viewing was not included in the questionnaire at the follow-up at age 43 years. The average TV show in Sweden is 30–60 min. At the 16-year and 21-year data collection, Sweden had only two TV channels (both non-commercial public service channels).
Covariates
Physical activity (sport activities or exercise) during the last 12 months was reported with six response options: daily, several times per week, once a week, several times per month, once a month and seldom.7 The last three categories were merged based on the low number in each of these categories. Cumulative physical inactivity was operationalised as the number of life periods in the lowest frequency category assessed at ages 16, 21, 30 and 43 years. Assessment of socioeconomic status in adolescence was based on parental occupation and has been previously described.7 ,9 Educational attainment was reported at age 43 years in five categories: compulsory school (9 years), 2 years of senior high school, 3–4 years of senior high school, university-preparatory high school or university studies. Annual consumption of alcohol was estimated from self-reported typical frequency and quantity of alcoholic beverage consumption. The alcohol consumption was coded as high or low using the sex-specific 80th percentile as cut-off. Family history of diabetes, smoking and snuff use were self-reported and dichotomised. Accumulated periods of alcohol consumption, smoking and snuff use were operationalised as the number of periods in the ‘high’ category assessed at ages 16, 21, 30 and 43 years data collections. At age 43 years, the questionnaire included two separate questions on intake of fruits (including berries) and vegetables (including root vegetables). The responses were summarised to estimate daily intake of fruits and vegetables and coded as high or low intake using the 20th percentile (≤1.21 portions/day) as cut-off. Body Mass Index (BMI) was calculated from measured height and weight as weight in kilograms divided by the square of height in metres. Obesity was defined as a BMI ≥30 at ages 30 and 43 years. At age 16 years, obesity was defined using the International Obesity Task Force cut-offs (BMI ≥28.89 for boys and BMI ≥29.4 for girls).12
Statistical analysis
Correlations were calculated using Spearman’s rank correlation. A p value of less than 0.05 was considered significant. Logistic regression models were used to estimate ORs and 95% CIs. Covariates were included in multivariate models if they met the criteria of being significantly associated with the metabolic syndrome (p<0.05). Cumulative risk was assessed using cumulative frequent TV viewing as the predictor with potential confounders included as covariates in separate models, controlling for (A) sex, BMI at age 16 years and family history of diabetes, (B) accumulated periods of physical inactivity and smoking, snuff use and alcohol consumption assessed at ages 16, 21, 30 and 43 years, and intake of fruits and vegetables at age 43 years (C) socioeconomic disadvantage at age 16 years, and educational attainment at age 43 years. The final model included all potential confounders. We did not adjust for changes in BMI after age 16 years as we considered such changes to be part of a potential causal chain. Still, we cannot exclude the possibility of overadjustment bias in model 3 as other covariates may also be on a causal path from exposure to outcome. To test for sensitive period, TV viewing at ages 16, 21 and 30 years were included as predictors, stepwise adjusting for (A) TV viewing at all ages and (B) potential confounders at ages 16 and 43 years. In order to evaluate whether the association between TV viewing at age 16 years and the metabolic syndrome at age 43 years was mediated by weight gain between age 16 and 30 years, BMI at age 30 years was added to the fully adjusted model (model 3). The indirect effects of TV viewing at age 16 years on the metabolic syndrome via BMI at age 30 years, TV viewing at age 21 years and TV viewing at age 30 years, were tested for significance using a bootstrap procedure.13 Mean indirect effects and bias corrected (BC) 95% CIs were calculated using 5000 bootstrap resamples. The BC 95% CI indicates significant indirect effects if it does not contain zero. We found no significant interaction between TV viewing at age 16 years and sex on presence of the metabolic syndrome at age 43 years (p=0.856). Thus, the analyses were not stratified by sex. Missing data in covariates ranged from 0% (sex and BMI at age 16 years) to 3.2% (BMI at age 30 years). We used χ2 test to evaluate the relation between our key variables and presence of missing data. Individuals with missing data (n=61) did not differ significantly from those with complete data regarding TV viewing at age 16 years (p=0.479), 21 years (p=0.108) and 30 years (p=0.569), and the metabolic syndrome at age 43 years (p=0.314). To retain study power in multivariate regression analysis, missing indicator categories were used for missing categorical covariates. Statistical analyses were conducted using SPSS Statistics, V.19 (SPSS, Chicago, Illinois, USA).
Results
At age 43 years, the prevalence of the metabolic syndrome among the 855 participants was 27.3% (central obesity 59.7%, raised triglycerides 24.6%, low HDL-C 28.8%, raised blood pressure 41.1%, and raised fasting glucose 18.1%). Descriptive statistics for participants with and without the metabolic syndrome at age 43 years are presented in table 1.
Descriptive statistics for participants from the Northern Swedish Cohort
TV viewing at age 16 years was weakly related to TV viewing at age 21 years (Spearman correlation coefficient: 0.254, p<0.001) and TV viewing at age 30 years (Spearman correlation coefficient: 0.199, p<0.001). Figure 1 and table 2 shows OR for presence of the metabolic syndrome at age 43 years on cumulative frequent TV viewing based on the data collections at ages 16, 21 and 30 years.
Association of cumulative frequent television viewing (age 16–30 years) and the metabolic syndrome (age 43)
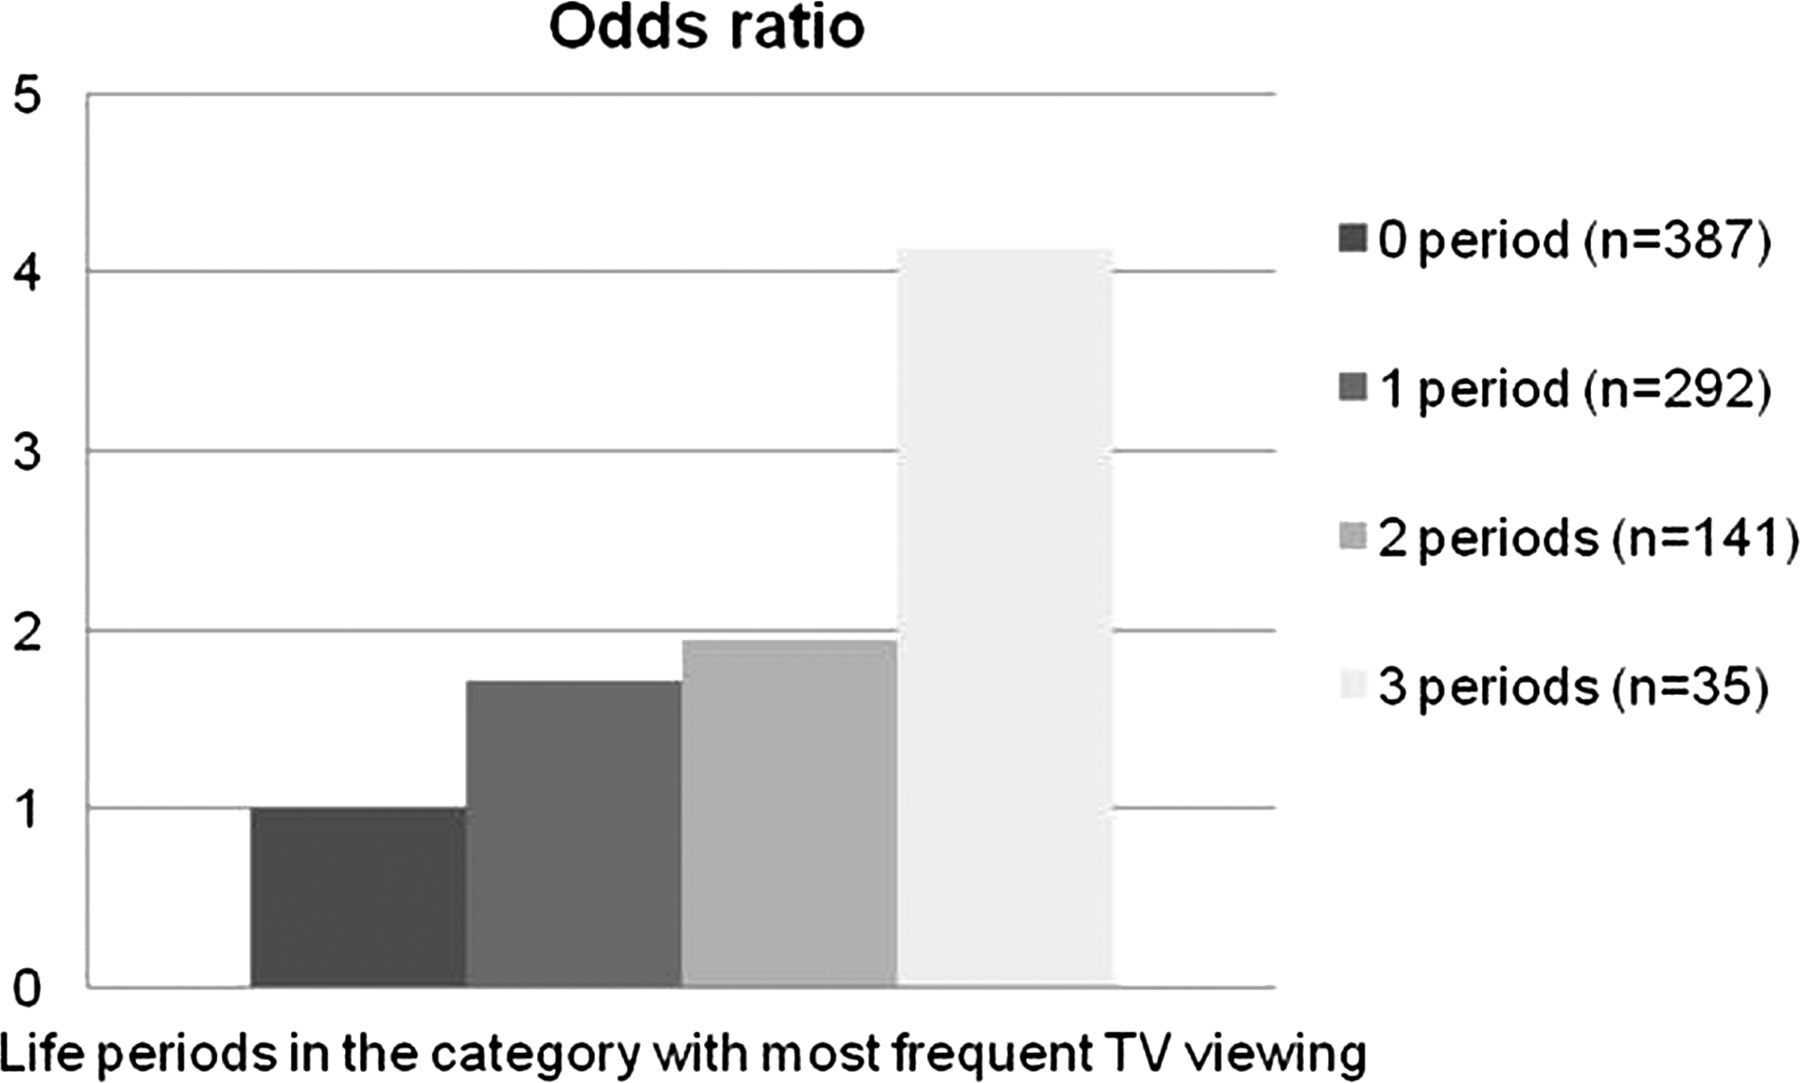
OR (unadjusted) for presence of the metabolic syndrome at age 43 years on cumulative frequent television viewing at ages 16, 21 and 30 years.
The association between cumulative frequent TV viewing and the metabolic syndrome components, adjusted for covariates in model 3, was statistically significant for central obesity (p for trend = 0.048) and raised fasting glucose (p for trend = 0.006), but not for raised triglycerides (p for trend = 0.147), low HDL-C (p for trend = 0.139), and raised blood pressure (p for trend = 0.115) (data not shown in tables).
Table 3 shows the results for the analysis of TV viewing at age 16 years as a sensitive period for the development of the metabolic syndrome at age 43 years.
Association of television (TV) viewing (ages 16, 21 and 30 years) and the metabolic syndrome (age 43 years)
Compared with those watching one show/week or less, watching several shows/day at age 16 years was associated with increased risk of the metabolic syndrome at age 43 years in the fully adjusted model. When BMI at age 30 years was included in model 3, the association became non-significant (p for trend = 0.111). The indirect effect of TV viewing at age 16 years on the metabolic syndrome via BMI at age 30 years was statistically significant (mean indirect effect = 0.199, BC 95% CI 0.088 to 0.321), but not the indirect effects via TV viewing at age 21 years (mean indirect effect = 0.033, BC 95% CI −0.035 to 0.1050), and 30 years (mean indirect effect = 0.078, BC 95% CI −0.054 to 0.033). In order to explore a possible bidirectionality in the relationship between TV viewing at age 16 years and the metabolic syndrome at age 43 years, we tested the correlation between BMI at age 16 years and TV viewing at age 21 years (Spearman correlation coefficient: −0.072, p=0.036) and age 30 years (Spearman correlation coefficient: 0.004, p=0.897). The association between TV viewing at age 16 years and the metabolic syndrome at age 43 years, adjusted for the covariates in model 3, was significant for low HDL-C (p for trend = 0.015), but not for central obesity (p for trend = 0.163), raised triglycerides (p for trend = 0.201), raised blood pressure (p for trend = 0.158), and raised fasting glucose (p for trend = 0.451) (data not shown in tables).
Discussion
The findings of this study provide novel evidence for an ‘accumulation of risk’5 and potential ‘sensitive period’6 related to the associations of TV viewing with the metabolic syndrome. We observed a dose-dependent relationship for the number of life periods of frequent TV viewing during adolescence and early adulthood with cardio-metabolic risk in mid-adulthood. The significance of the association with adjustment for comprehensive sets of potential confounding variables indicates that frequent TV viewing constitutes a distinct unhealthy behaviour and that the association cannot be fully explained by other coexisting health behaviours or socioeconomic status. TV viewing at age 16 years was associated with the metabolic syndrome at age 43 years after adjustment for potential confounders and TV viewing at ages 21 and 30 years. This result indicates that adolescence may constitute a sensitive period, and that the long-term cardio-metabolic health effects of frequent TV viewing in adolescence are, to a large extent, independent of exposure to frequent TV viewing in early adulthood.
A few prospective studies have provided support for a longitudinal relationship between TV viewing or total screen-viewing time in childhood and adolescence and cardiovascular risk at age 26 years14 and at age 21 or 27 years.15 A meta-analysis of four randomised controlled trials showed that reducing TV viewing and total screen time in children and youth can improve body composition with an overall effect of −0.89 in BMI.4 The findings in the present report adds further understanding to how cardio-metabolic risk in mid-adulthood may develop through accumulation of sedentary behaviour over the life course, and also that this process may start in adolescence or earlier. By analysing the relationships with the metabolic syndrome components we found that TV viewing at age 16 years was associated with central obesity and raised fasting glucose, whereas cumulative TV viewing (also reflecting adult TV viewing) was associated with low HDL-C. This indicates that potential cardio-metabolic effects may differ between adolescent and adult TV viewing. However, it should be noted that these associations were tested in slightly different models, and are therefore, not directly comparable.
There are a number of possible explanations as to why TV viewing during adolescence may constitute a sensitive period for future cardio-metabolic health. TV viewing is at the lower end of the energy expenditure spectrum, particularly in youth.16 Also, TV viewing and other screen-viewing behaviours have shown to disturb sleep patterns in adolescents,17 which in turn has been linked to obesity18 and hypercholesterolaemia.19 It has been suggested that short sleep duration in adolescence, a critical development period with a greater sleep need than in adults, may be especially detrimental to metabolic health.20 This hypothesis is supported by data from prospective studies, showing that the relationship between short sleep duration and weight is most apparent among children and adolescents, and weakens with age.21 Several pathways linking short sleep duration with obesity have been suggested based on experimental studies of sleep deprivation. For example, partial sleep deprivation elevates hunger and appetite, particularly for high fat and high carbohydrate foods. These changes correspond with metabolic and neuroendocrine changes, such as insulin resistance and altered levels of leptin and ghrelin, two hormones that regulate appetite and satiety.22 However, large prospective studies with objective measurements of the exposures23 are needed to establish a potential causal link between screen-viewing behaviours, short sleep duration and metabolic consequences.
The association between TV viewing at age 16 years and the metabolic syndrome at age 43 years was strongly attenuated when BMI at age 30 years was introduced as covariate in the model, and the indirect effect via BMI at age 30 years was significant. This suggests that the association is at least partly mediated by weight gain between ages 16 and 30 years. We did not have data on TV viewing at age 43 years and could not test a possible reverse direction of the TV viewing/metabolic syndrome association. However, BMI at age 16 years was not (or very weakly) related to TV viewing at ages 21 and 30 years, suggesting that the relationship is mainly unidirectional. This has important implications for public health as it emphasises the necessity of targeting the obesity pandemic and its health consequences by focusing prevention efforts on health behaviours among youth. A recent study from Estonia and Sweden reported an increase in total sedentary time from childhood (9 years) to adolescence (15 or 18 years) of 2 hours and 45 minutes a day.24 Similar findings have been shown in US,25 UK,26 and Vietnamese27 populations. Reductions in TV viewing should, therefore, be targeted in childhood, before it becomes a chronic behaviour.24
There are several limitations in the study. First, the question on TV viewing was altered at the follow-up at age 30 years which is likely to increase the bias in comparisons of TV viewing between different life periods. Nevertheless, as TV viewing at age 16 years could also be adjusted for TV viewing at age 21 years in the sensitive period analysis, it is not likely that the questionnaire changes at age 30 years lead to insufficient adjustment for later exposure. Second, as TV viewing was not assessed before the age of 16 years, we cannot exclude that frequent TV viewing before age 16 years is even more detrimental to future health. Third, the metabolic syndrome components were not assessed at age 16 years, making it difficult to draw firm conclusions regarding the direction of the association between TV viewing and the metabolic syndrome. However, obesity is considered as a driving force for the metabolic syndrome, and we were able to adjust for BMI at age 16 years. Fourth, we did not assess snacking or intake of sweetened beverages that may be specifically related to TV viewing.28 A recent study in adults showed that TV viewing time and snack food consumption are independently and jointly associated with the metabolic syndrome,29 but the generalisability of these results to younger populations is not clear.
In conclusion, as the first study investigating the longitudinal association between TV viewing and the metabolic syndrome using a life course epidemiological approach, our findings support the concepts of accumulation of risk and sensitive period. Our results indicate that cardio-metabolic risk in adulthood may represent a build-up of risk explained by sustained TV viewing over the life course and TV viewing during early life.
What is already known on this subject
-
Television (TV) viewing has been associated with cardio-metabolic risk.
-
Most of the evidence comes from cross-sectional studies.
-
Little is known about how this relationship unfolds over the life course.
What this study adds
-
The number of life periods of frequent TV viewing during adolescence and early adulthood influences cardio-metabolic risk in mid-adulthood in a dose-dependent manner.
-
TV viewing in adolescence may represent a sensitive period for the metabolic syndrome in mid-adulthood.
-
Reductions in TV viewing should be targeted in childhood before it becomes a chronic behaviour.
References
Supplementary materials
Supplementary Data
This web only file has been produced by the BMJ Publishing Group from an electronic file supplied by the author(s) and has not been edited for content.
Files in this Data Supplement:
- Data supplement 1 - Online supplement
Footnotes
-
Contributors PW was responsible for the concept and design of the study, analysed data, wrote early drafts and wrote the final manuscript. PEG was responsible for the concept and design of the study, gave final approval of the version to be published, made substantial contributions to analysis and interpretation of data and revised the manuscript critically for important intellectual content. BH was responsible for the concept and design of the study, gave final approval of the version to be published, made substantial contributions to analysis and interpretation of data and revised the manuscript critically for important intellectual content. MW was responsible for the concept and design of the study, gave final approval of the version to be published, made substantial contributions to analysis and interpretation of data and revised the manuscript critically for important intellectual content. AH was the principal investigator, conceived the Northern Swedish Cohort, collected data, was responsible for the concept and design of the study, gave final approval of the version to be published, made substantial contributions to analysis and interpretation of data and revised the manuscript critically for important intellectual content. PW is the guarantor for this manuscript.
-
Funding The study was supported by grants from the County Council of Västerbotten, the Swedish Research Council and Umeå University.
-
Competing interests PW and MW are funded by grants from the County Council of Västerbotten and the Swedish Research Council for Health, Working Life and Welfare. PEG and AH are funded by grants from Umeå University. BH is funded by NHMRC/National Heart Foundation Postgraduate Scholarship (grant number 1056320). No financial disclosures were reported by the authors of this paper.
-
Ethics approval the Regional Ethical Review Board in Umeå, Sweden.
-
Provenance and peer review Not commissioned; externally peer reviewed.
-
Data sharing statement Data available from the authors on request.